
Real-time monitoring for energy, machines and building systems
Get clear visibility of energy use, equipment performance and building conditions in one place.
Bring live energy data into one place, with dashboards and trends that make it easier to spot waste and stay in control.
Know more. React faster. Save money.

Remove the guesswork


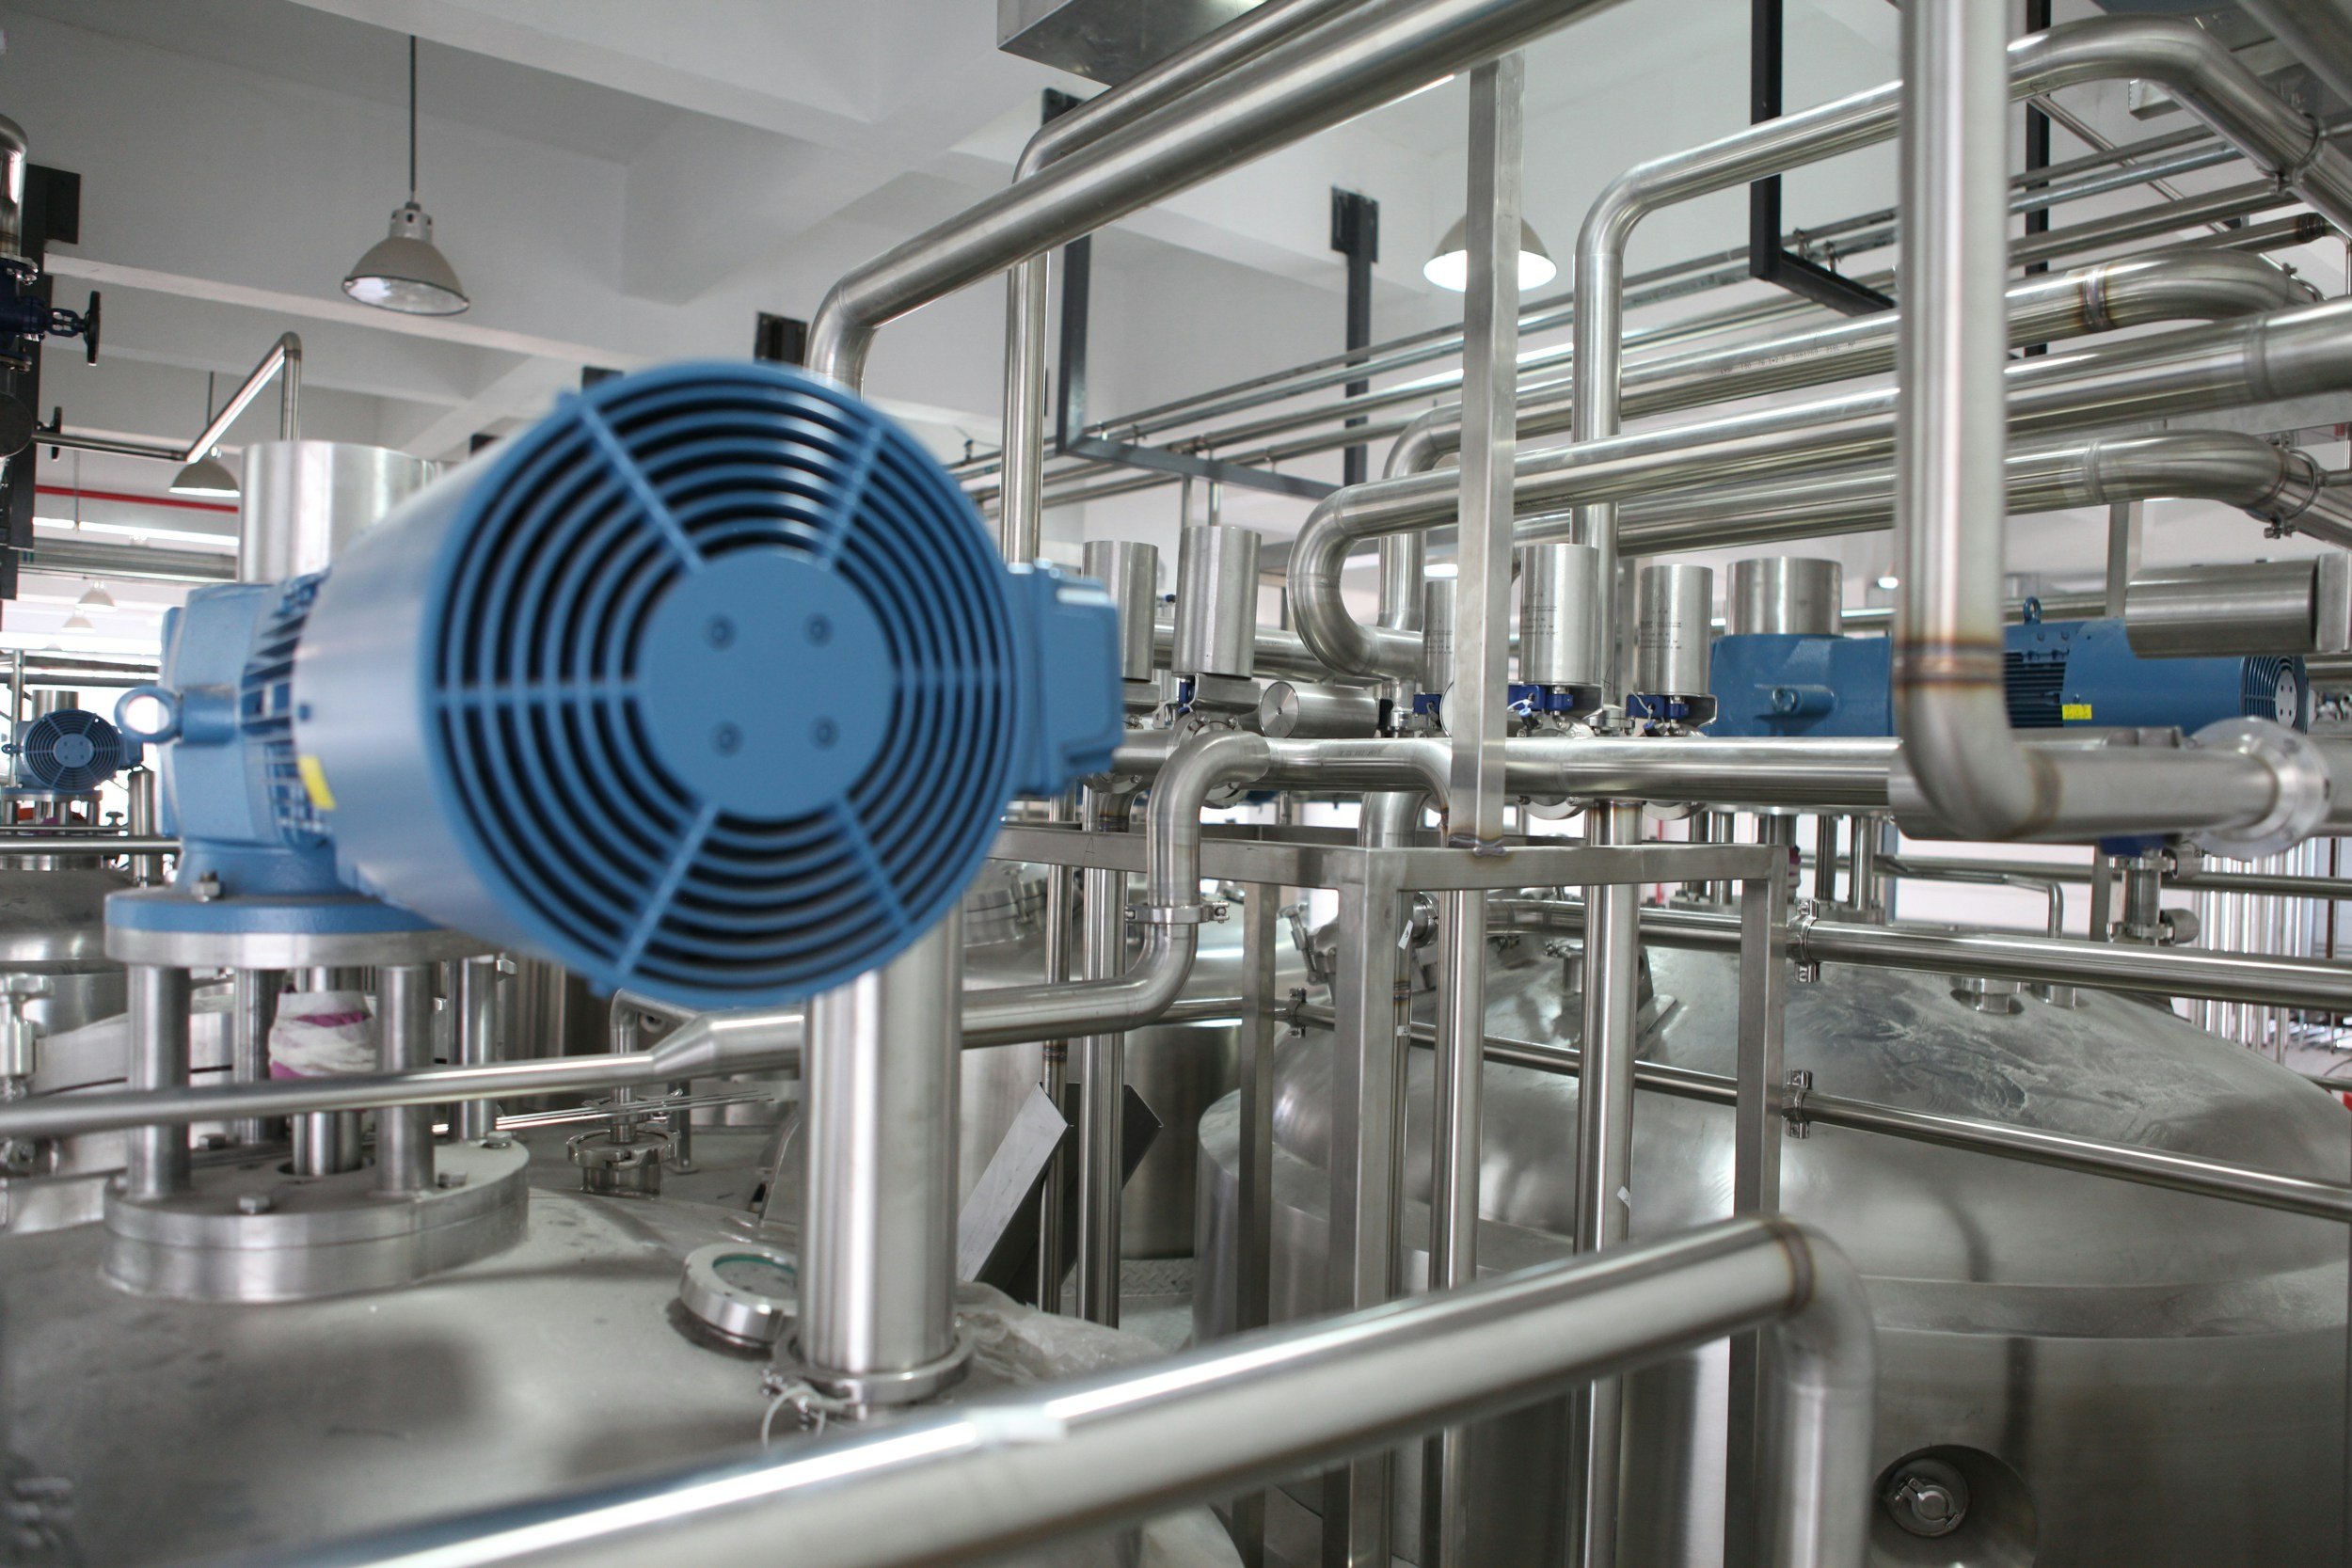
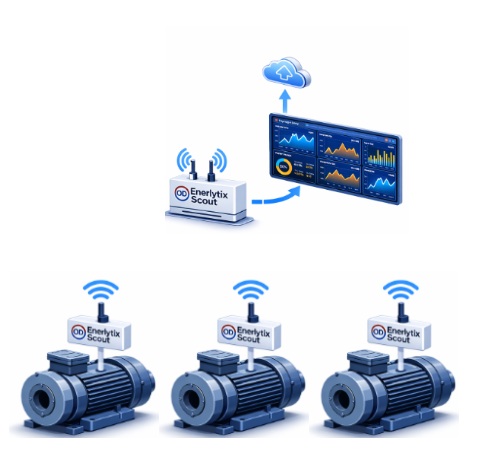
We install wireless communication energy monitoring devices, independent of your IT systems, for simple and secure deployment without WIFI!
Our sensors track everything from mains power to machine-level detail. Data is presented on your custom Enerlytix-Scout dashboard, giving you real-time visibility into what’s really happening.
✔️ Quick installation
✔️ See hidden energy waste instantly
✔️ Professional dashboard included
✔️ Foundation for compliance and savings
✔️ Understand machine utilisation
Energy Monitoring


How It Works
From first contact to live dashboard, we handle everything.
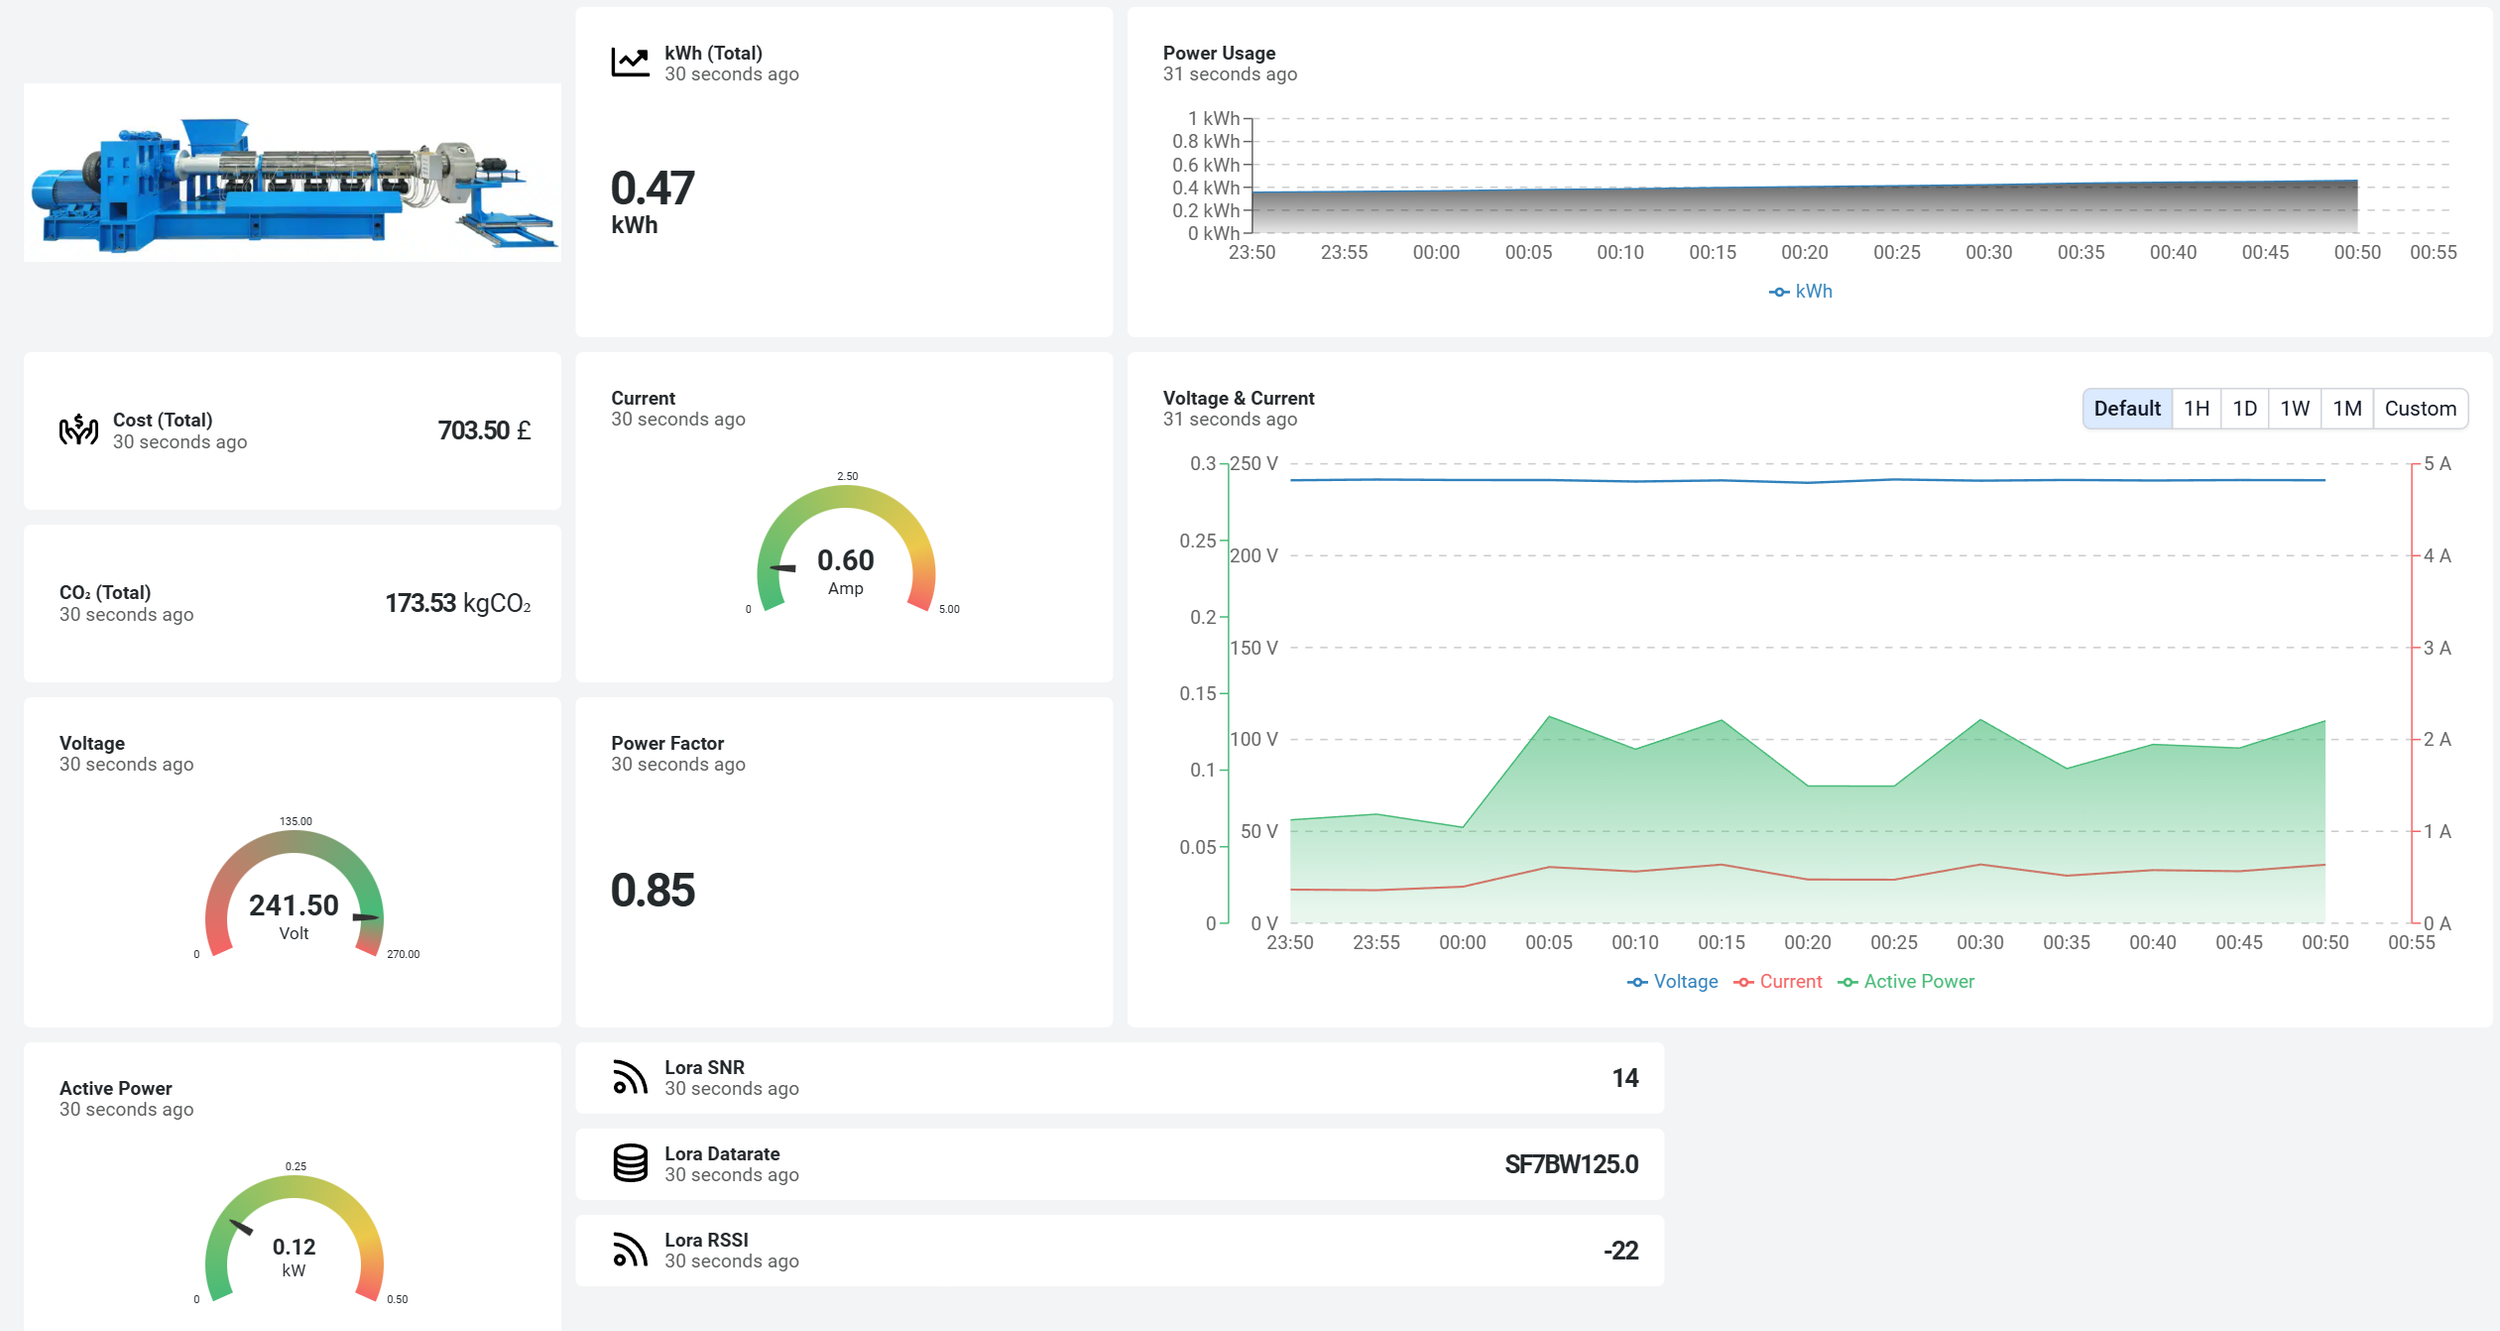
kWh (Total)
just now
86.4 kWh
Power Usage
£ Cost (This Week)
just now
£412.60
Current
Power Factor
0.87
CO2 (Total)
35.2 kgCO2
Voltage & Current
DefaultActive Power
Voltage
415.2 V
£ Cost (This Shift)
just now
£38.92
Shift utilisation
72%


Machine Utilisation & Downtime
Monitor when equipment is running, waiting or down, so you can spot issues earlier and improve how existing machines are being used.
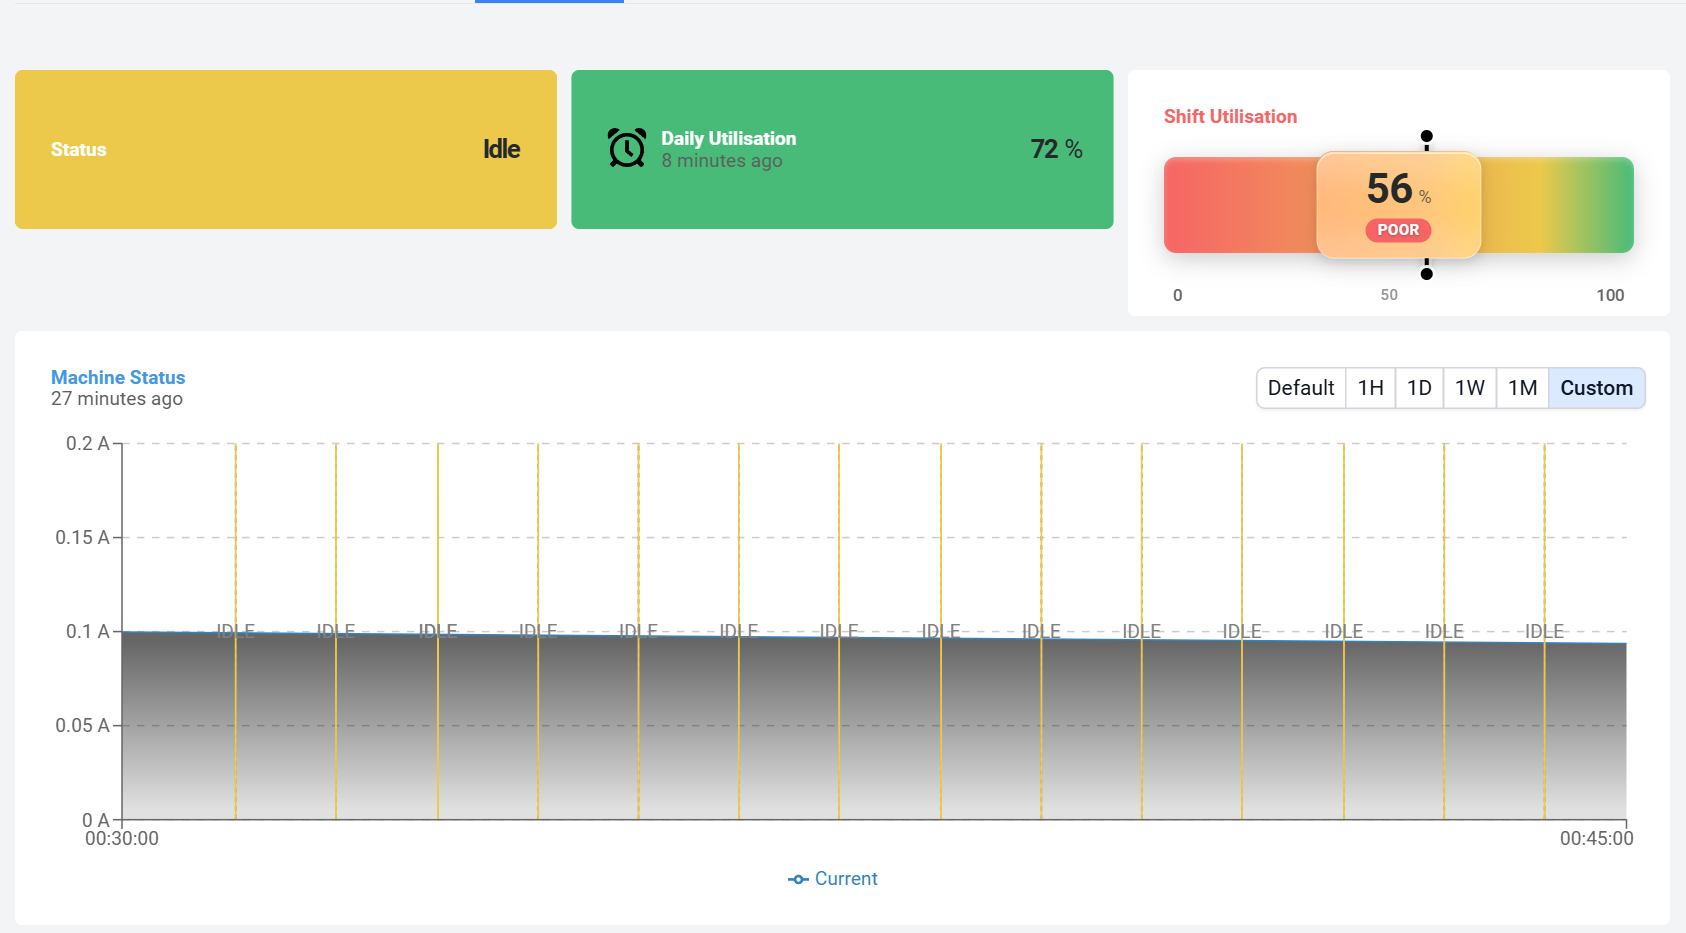
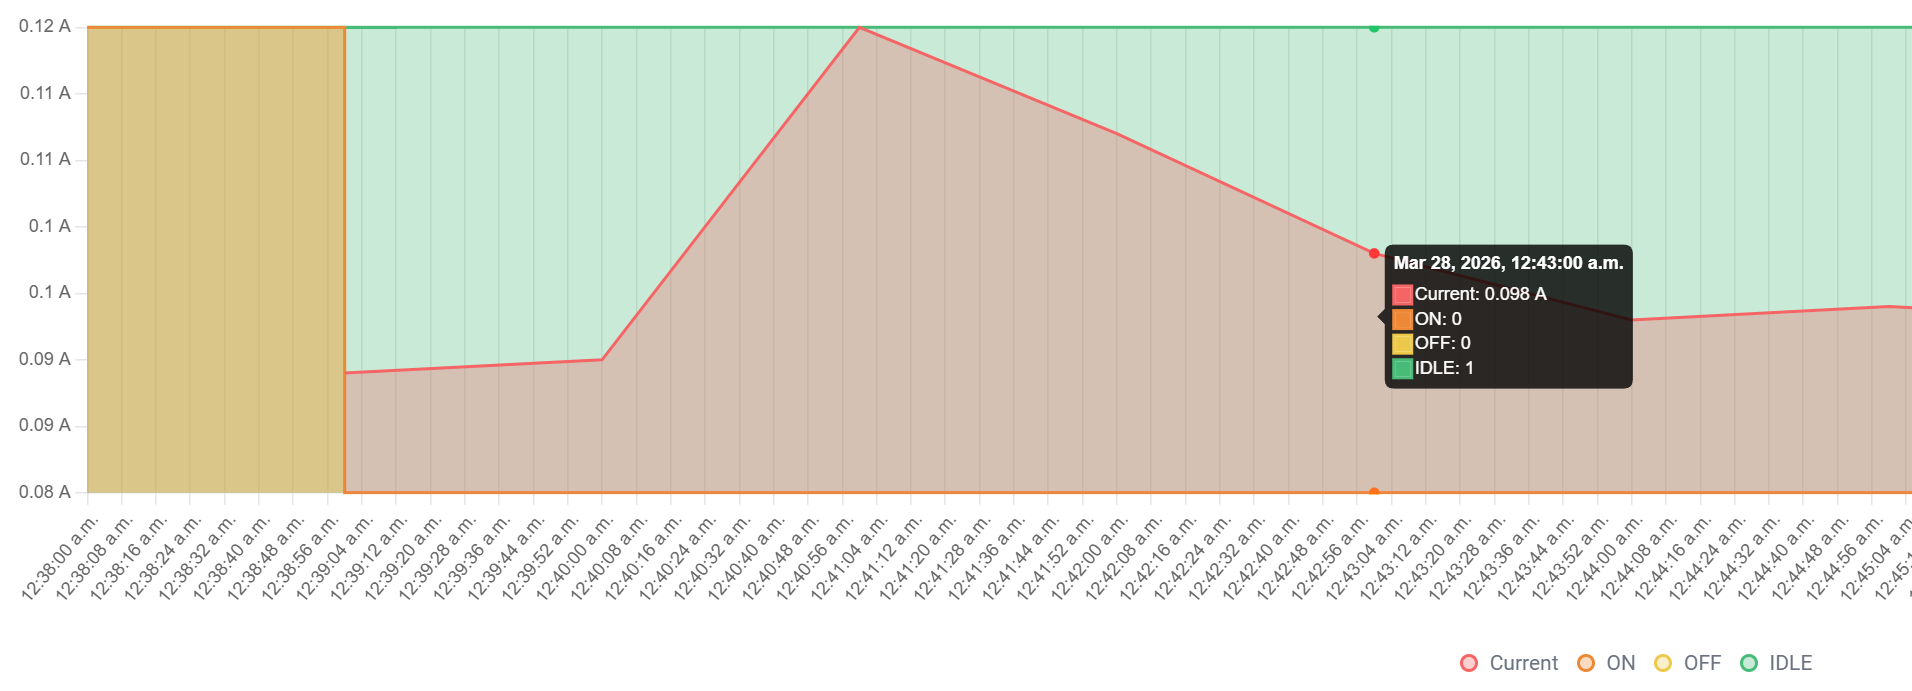
Know what’s running. Know what’s waiting. Know what’s costing time.
| Data point | CT Clamp | Power Hub |
|---|---|---|
| Current (A) | ✓ Measured | ✓ Measured |
| Energy consumption (kWh) & CO₂ | ~ Calculated | ✓ Measured |
| On / Off status, run time, utilisation | ✓ Measured | ✓ Measured |
| Voltage per phase (V) | — | ✓ Measured |
| Active power (kW) | ~ Calculated | ✓ Measured |
| Power factor (PF) | — | ✓ Measured |
| Reactive power (kVAr) | — | ✓ Measured |
| Apparent power (kVA) | — | ✓ Measured |
| Frequency (Hz) | — | ✓ On request |
| Harmonic distortion (THD %) | — | ✓ On request |
| Max demand current / power | — | ✓ On request |
| Reactive energy (kVArh) | — | ✓ On request |
Devices & Data

See exactly what your machines
are costing you. For free.
Get monitoring kit onto 4 of your machines and see real live energy data on the Scout platform - no contract, commitment or cost for 30 days.
How it works
Get in touch
We learn about your machines, spec the right kit for your setup, and agree the best way to get you live - self-install or an engineer visit from us.
We get your kit to you
CT clamp sensors and a LoRaWAN gateway tailored to your machines. We'll be in touch to arrange delivery or an on-site visit.
See live data from your own machines
Log into your Scout dashboard and see real energy data immediately.
Keep going or walk away
After 30 days, continue from £1/device/day or return the kit with our prepaid label.
Your trial dashboard
Active Power
11.9 kW
Cost today
£21.34
kWh today
86.4
CO2 today
17.8 kg
Power Factor POWER HUB
—
Reactive Power POWER HUB
— kVAR
Voltage POWER HUB
— V
Peak Demand POWER HUB
— kVA
Do I need to install it myself?
Simply clip the clamp around the wire to start seeing live data. If you prefer, we can arrange an engineer to visit.
What if I want to return it?
A prepaid returns label is included with every kit. Send it back any time within 30 days. No questions asked, no invoice.
What happens after 30 days?
Continue with the trial kit for less than £1/device/day, or send the kit back.
Ready to see your data?
Get in touch. We'll work out the right setup for your machines and take it from there.
Contact usLimited trial spaces · No commitment · Free returns
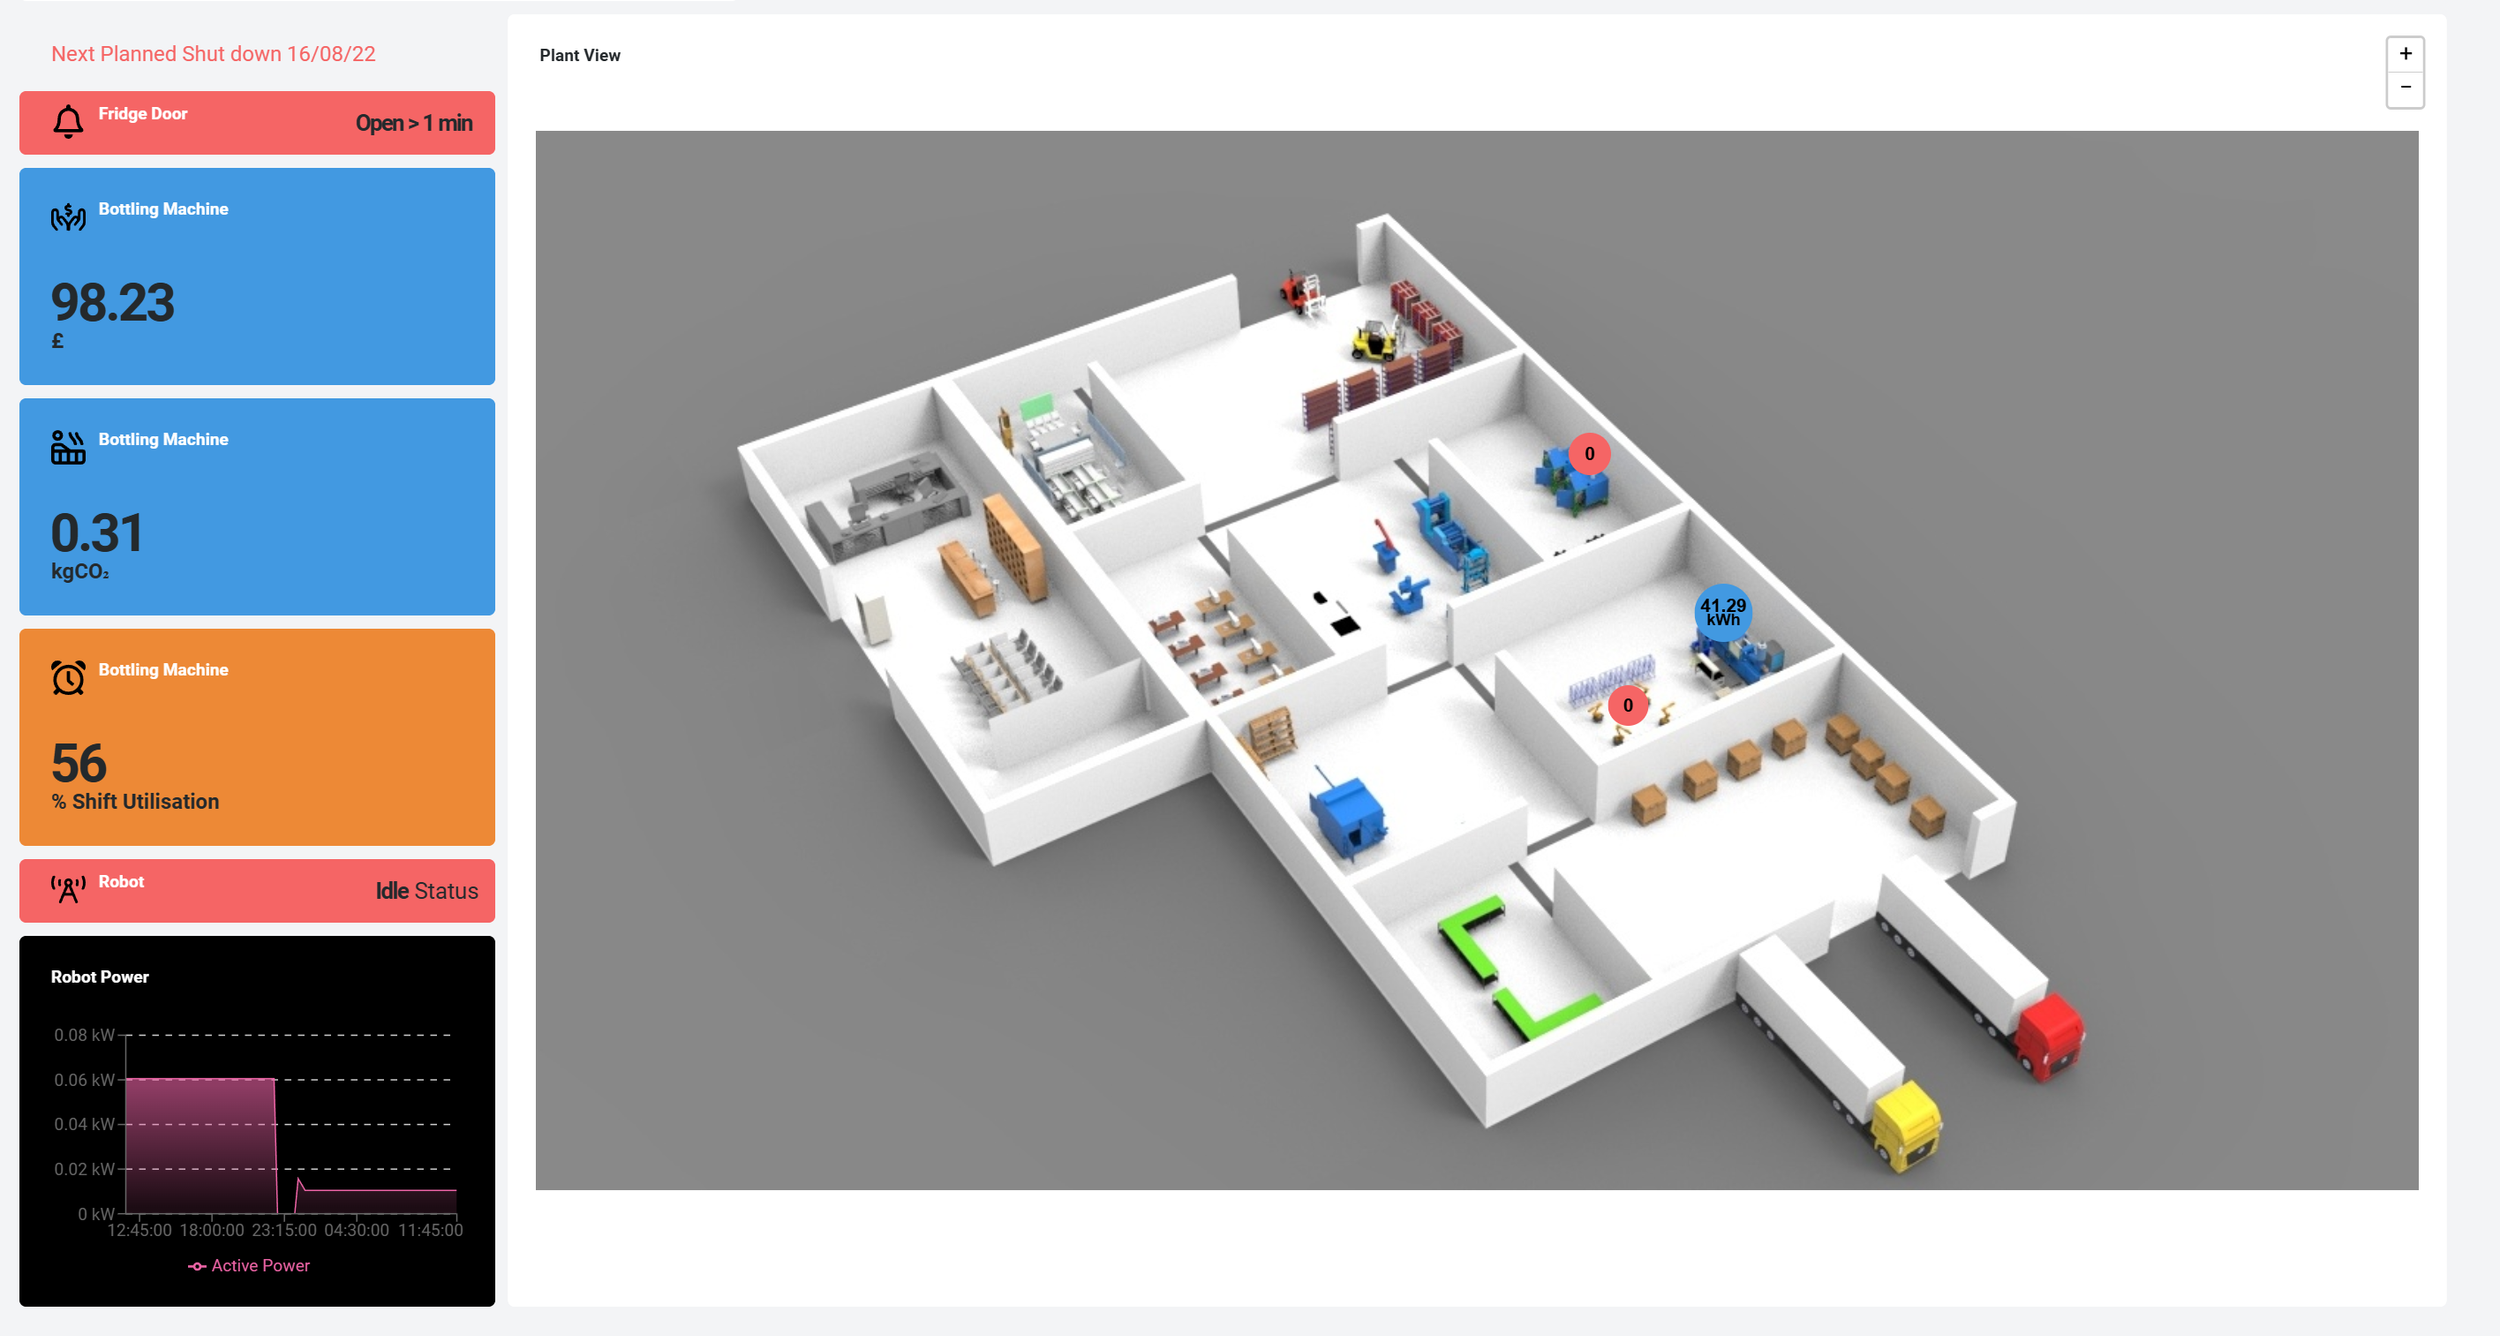
See your entire site in one live view. Enerlytix maps key machines and areas into a clear plant layout, showing energy use, alarms, utilisation, and asset status in real time. That means faster decisions, better visibility, and a clearer understanding of where energy, cost, and operational issues are coming from.
See the Whole Site at a Glance

Who is it For?
We help organisations across sectors — from SMEs to large production sites — who face rising costs, tighter regulations, and increasing pressure to do more with less.
Same Platform,
Endless Capabilities
One system. Multiple applications. All managed from your Enerlytix-Scout dashboard.

Discreet clamp-on sensors fit to the outside of pipework with no interruption to your water supply. Continuously log temperatures at key points and alert when conditions drift into higher-risk ranges.
- Reduce routine manual temperature rounds and paperwork
- Support compliance with COSHH, ACOP L8 and HSG274

Sensors placed inside fridges, freezers and cold rooms with no disruption to operations. Continuously log temperature and send instant alerts if readings drift outside set limits — ideal for food and pharmaceuticals.
- Less manual checking, lower risk of spoilage and waste
- Consistent records for compliance and inspections

Monitor CO₂, temperature, noise, fumes and humidity in real time with no disruption to occupants. Receive instant alerts when parameters exceed limits, helping you respond quickly and keep spaces comfortable and safe.
- Less guesswork around ventilation and heating
- Clear evidence for stakeholders and building management