Remote Energy Monitoring
From live kWh and machine costs to predictive maintenance alerts; Enerlytix gives you the data and support to cut waste and downtime.
Stop Guessing Where Your Energy Is Going.
Start Seeing It In Real-time.
Most sites measure energy from one main meter, updated every 30 minutes. That tells you how much — but never where, why, or which machine is costing you the most.
↓ See how it worksMost sites measure energy from one main meter, updated every 30 minutes. Here's the problem with that:
- ✓Periods when overall energy use is high
- ✓Total site consumption over time
- ✓Monthly kWh spend
- ✗Which machine or area is wasting energy
- ✗Equipment left running overnight or out of hours
- ✗Electrical inefficiencies like poor power factor
- ✗Real running cost per machine or process
- ✗Carbon emissions at machine level
Simple, Continuous Energy Insight.

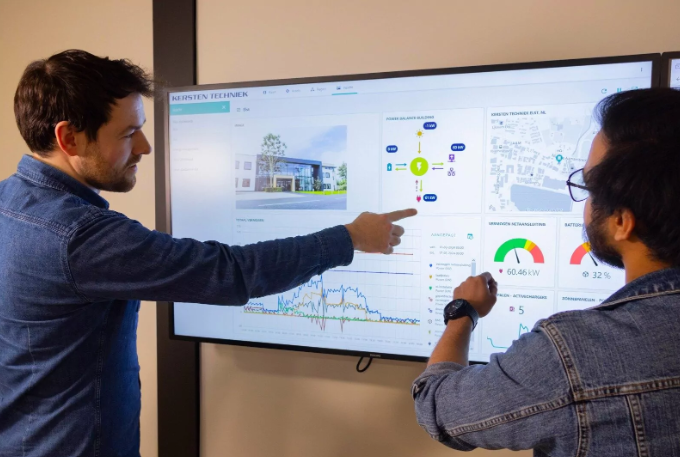
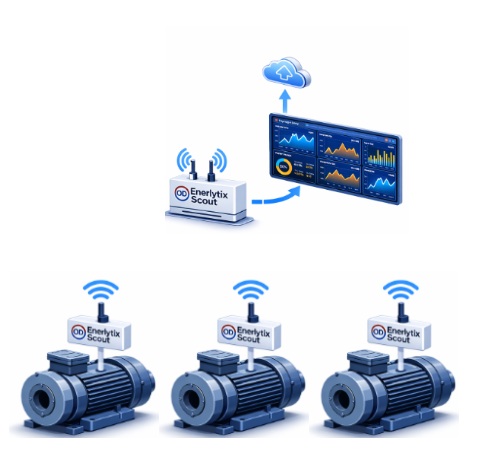
Enerlytix-Scout is an energy monitoring system designed to give clear visibility of how electricity is actually used across your site. Turning a single site meter into a network of energy monitors. Installed directly on individual circuits and equipment, Scout continuously monitors energy usage and sends live data to a central dashboard - making waste, cost and carbon emissions visible in real time
With energy monitoring;
lower electricity bills
Connect Wirelessly to the Cloud
Our meters and gateways connect your machines securely to the cloud without complex wiring. Whether you’re monitoring one line or an entire plant, data flows in real time, anywhere you need it.
To cut costs and carbon, you need to monitor generation, consumption, and storage, and then control them together for the best financial and sustainability outcomes.
You’ll get a clear configurable dashboard supplemented by easy-to-use mobile tools for staff, all tailored to your site and hosted in a secure environment.
See the Whole Site at a Glance
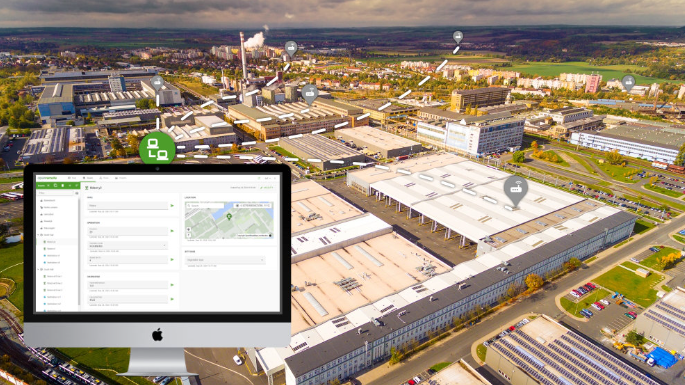
See your entire site in one live view. Enerlytix maps key machines and areas into a clear plant layout, showing energy use, alarms, utilisation, and asset status in real time. That means faster decisions, better visibility, and a clearer understanding of where energy, cost, and operational issues are coming from.
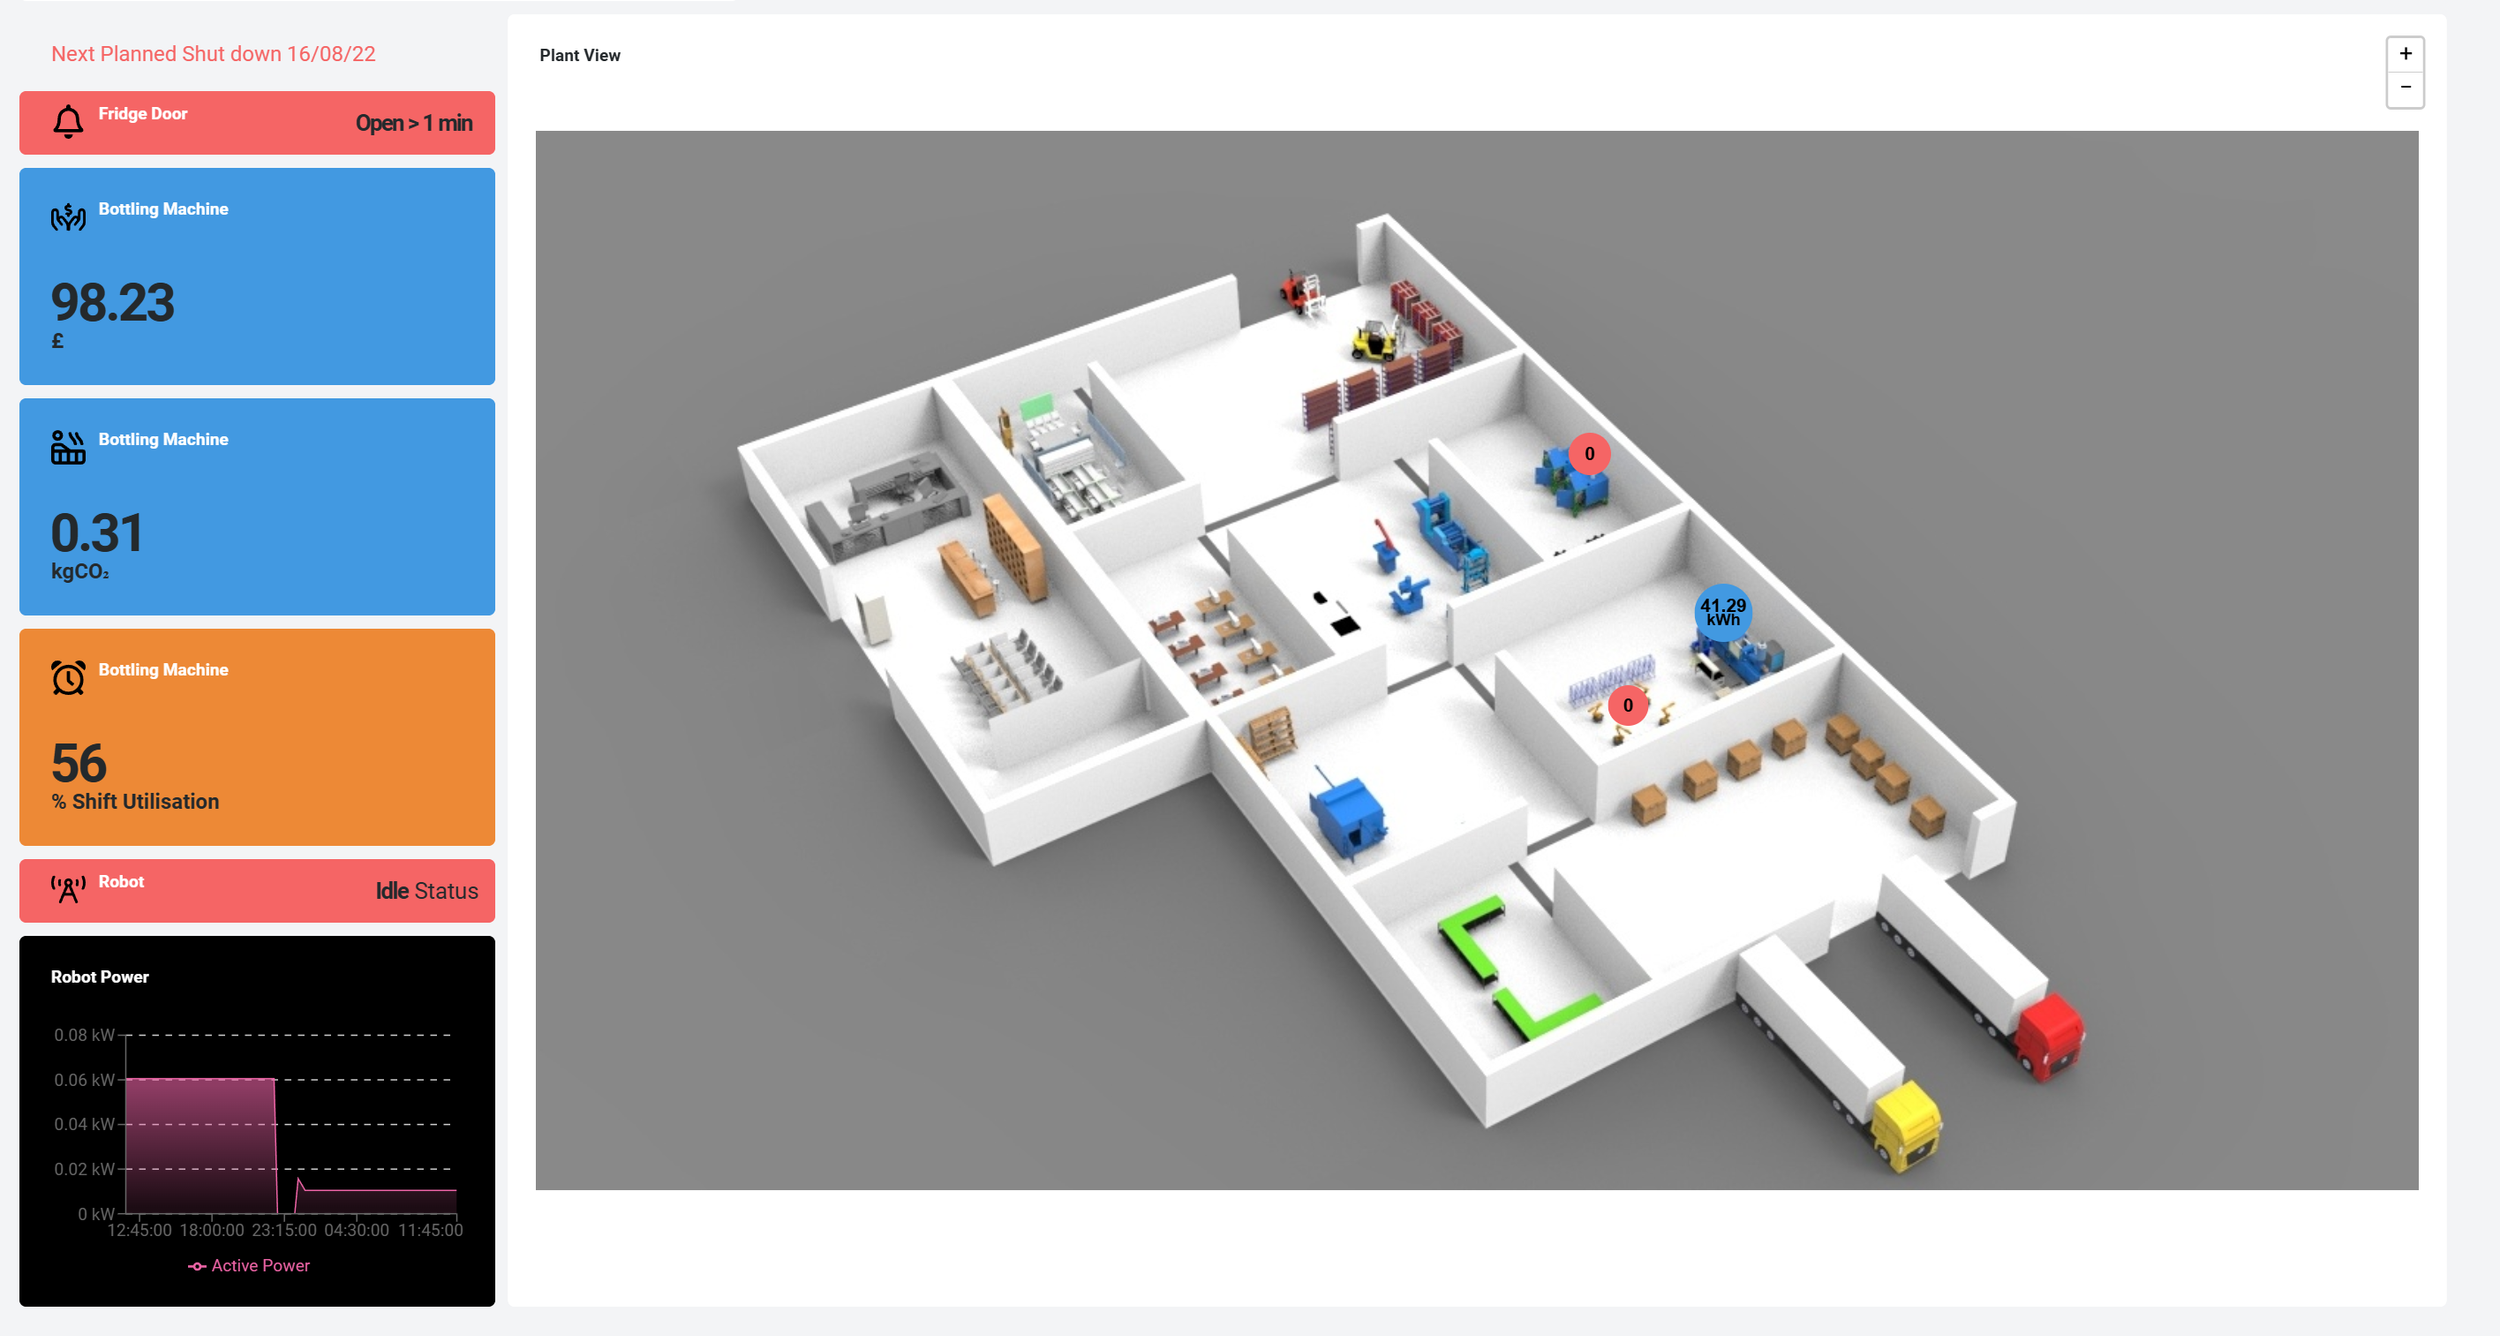
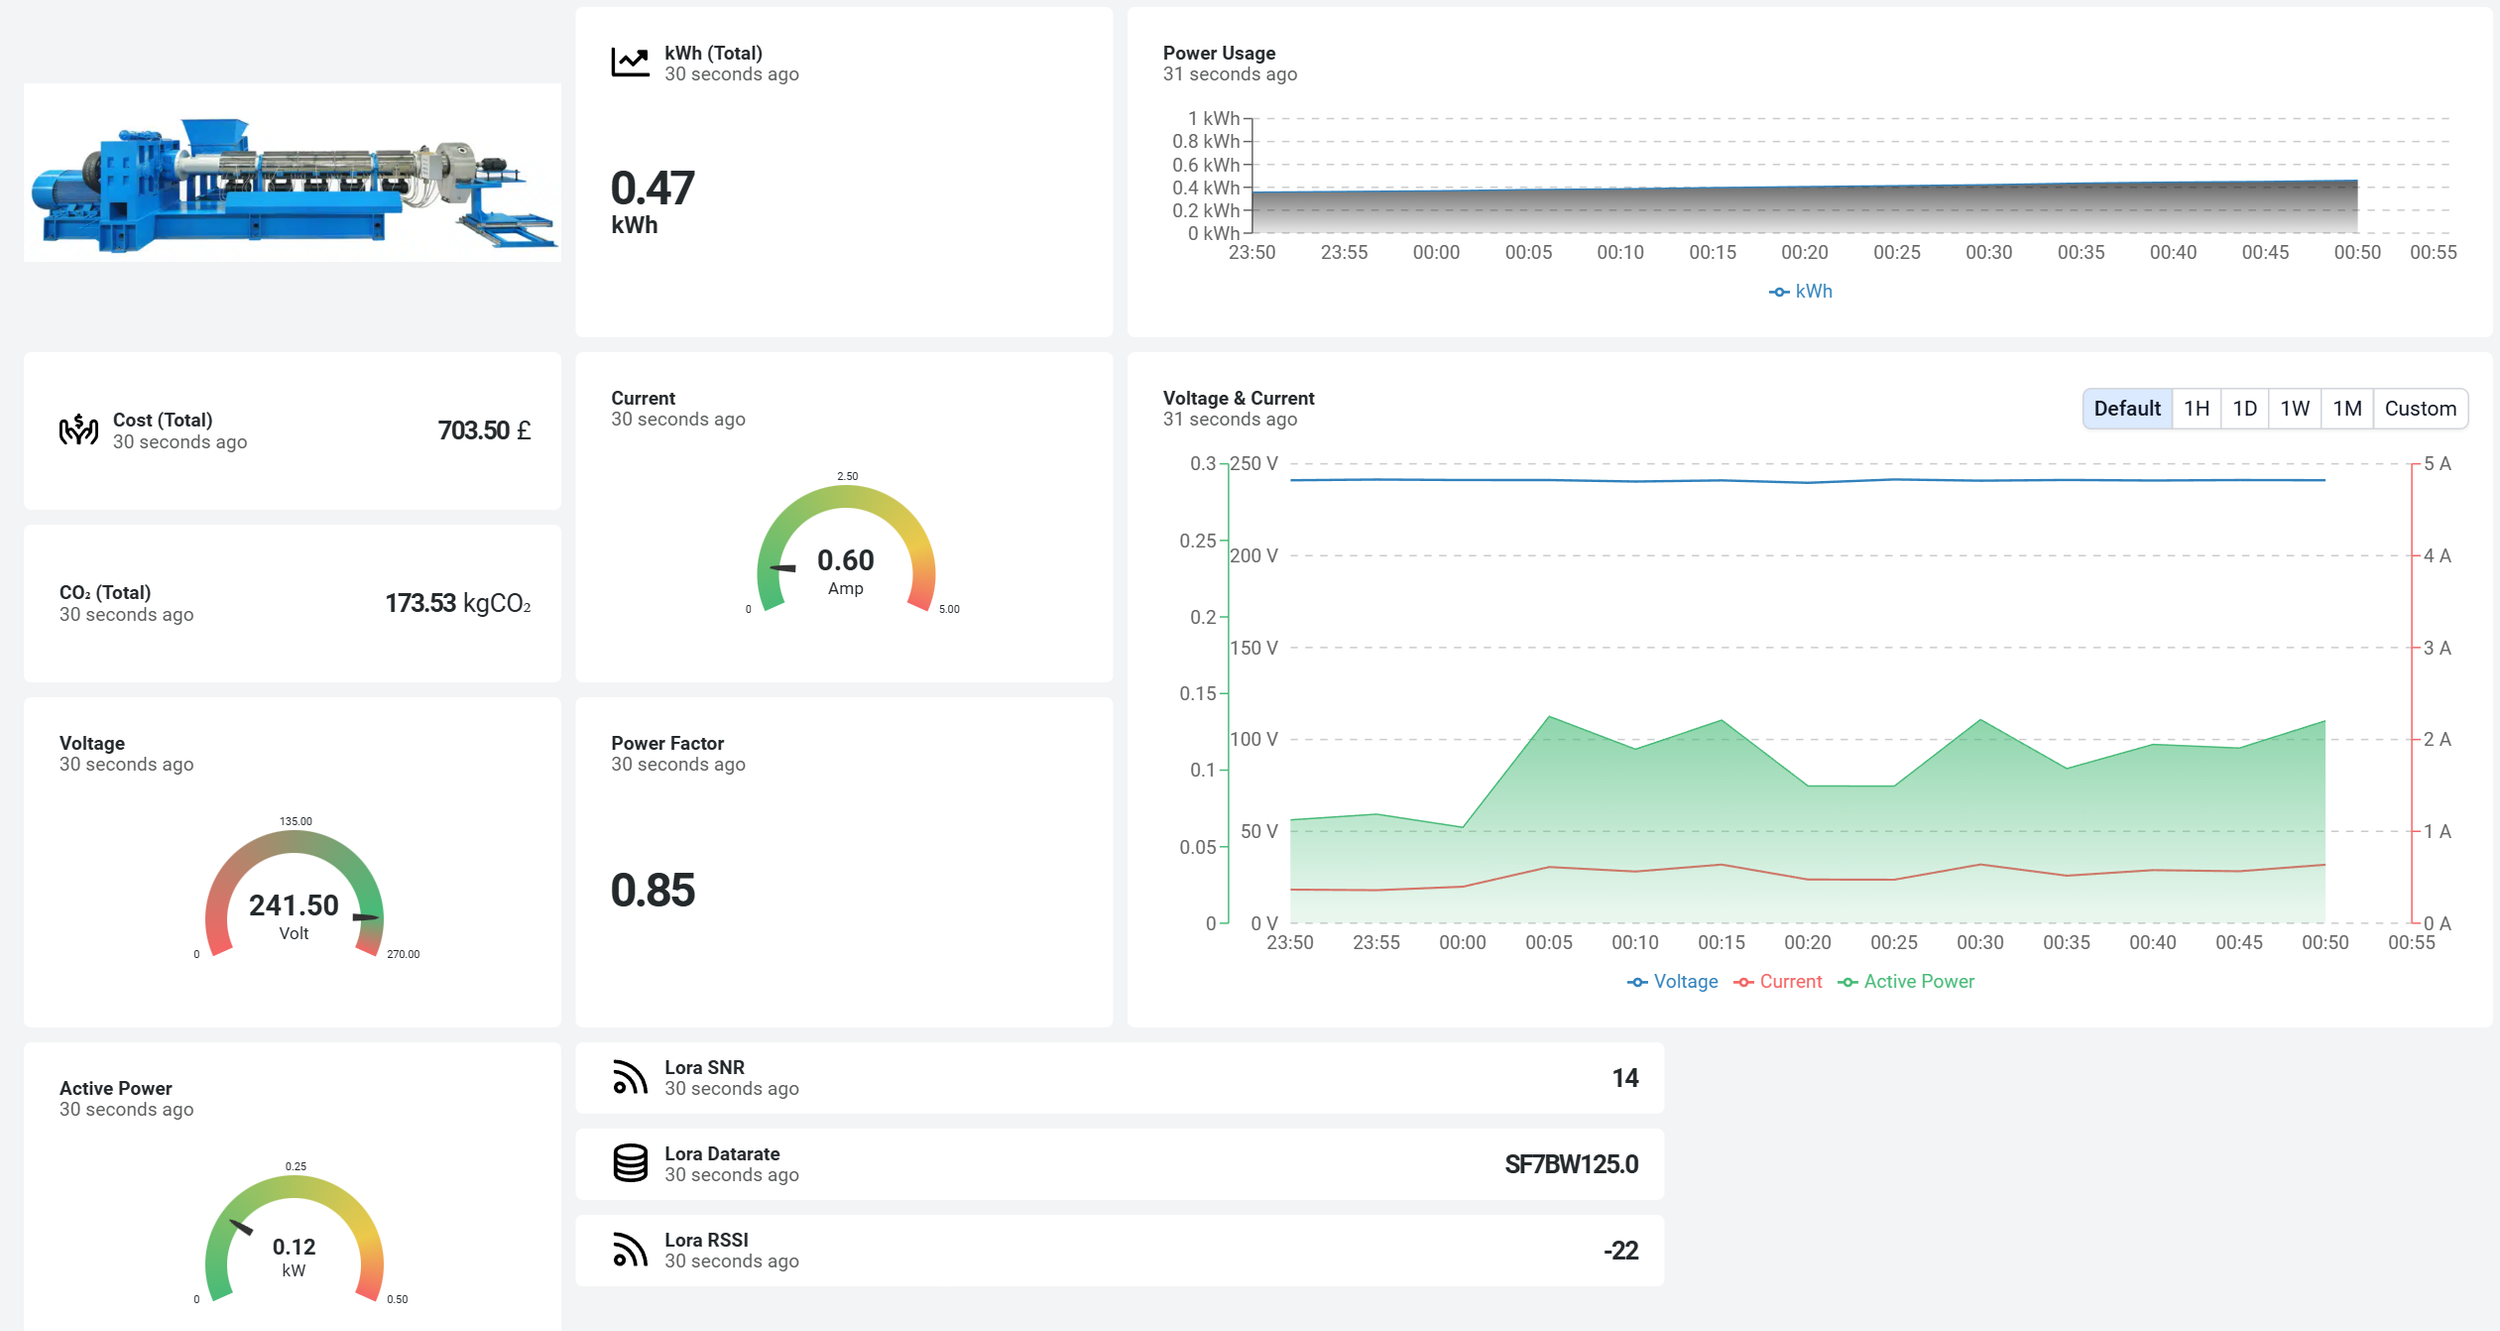
See your true running costs as they happen, at a granular level. Pull in your tariff and view both cumulative site-wide spend, plus cost-per-line or machine.
Track Energy Costs and CO₂ in Real Time
Most sites only see a monthly bill and a single meter reading. Enerlytix-Scout measures the electrical parameters engineers use to diagnose waste, overloads and reliability risks on a machine or process level.
True running cost and peak demand visibility
Power quality and imbalance indicators
Evidence to support maintenance, compliance, and optimisation
Full Visibility
Devices & Data
| Data point | CT Clamp | Power Hub |
|---|---|---|
| Current (A) | ✓ Measured | ✓ Measured |
| Energy consumption (kWh) & CO₂ | ~ Calculated | ✓ Measured |
| On / Off status, run time, utilisation | ✓ Measured | ✓ Measured |
| Cable temperature (°C) | ✓ Measured | ✓ Measured |
| Voltage per phase (V) | — | ✓ Measured |
| Active power (kW) | ~ Calculated | ✓ Measured |
| Power factor (PF) | — | ✓ Measured |
| Reactive power (kVAr) | — | ✓ Measured |
| Apparent power (kVA) | — | ✓ Measured |
| Frequency (Hz) | — | ✓ Measured |
| Harmonic distortion (THD %) | — | ✓ Measured |
| Max demand current / power | — | ✓ Measured |
| Reactive energy (kVArh) | — | ✓ Measured |
Enerlytix helps you evidence energy performance and maintain an audit trail using real monitoring data. Supporting ISO 50001 alignment, internal reporting, and customer sustainability requirements.
Compliance, ISO, and Sustainability

Schedule weekly or monthly reports automatically and export the data you need for audits, management updates, or KPI tracking
Automate Reporting

Get instant alerts including SMS and email if your pre-determined parameters are met. Predictive maintenance alerts can be tailored by criticality, ensuring staff focus on what matters first.
Real-Time Alerts & Condition Monitoring
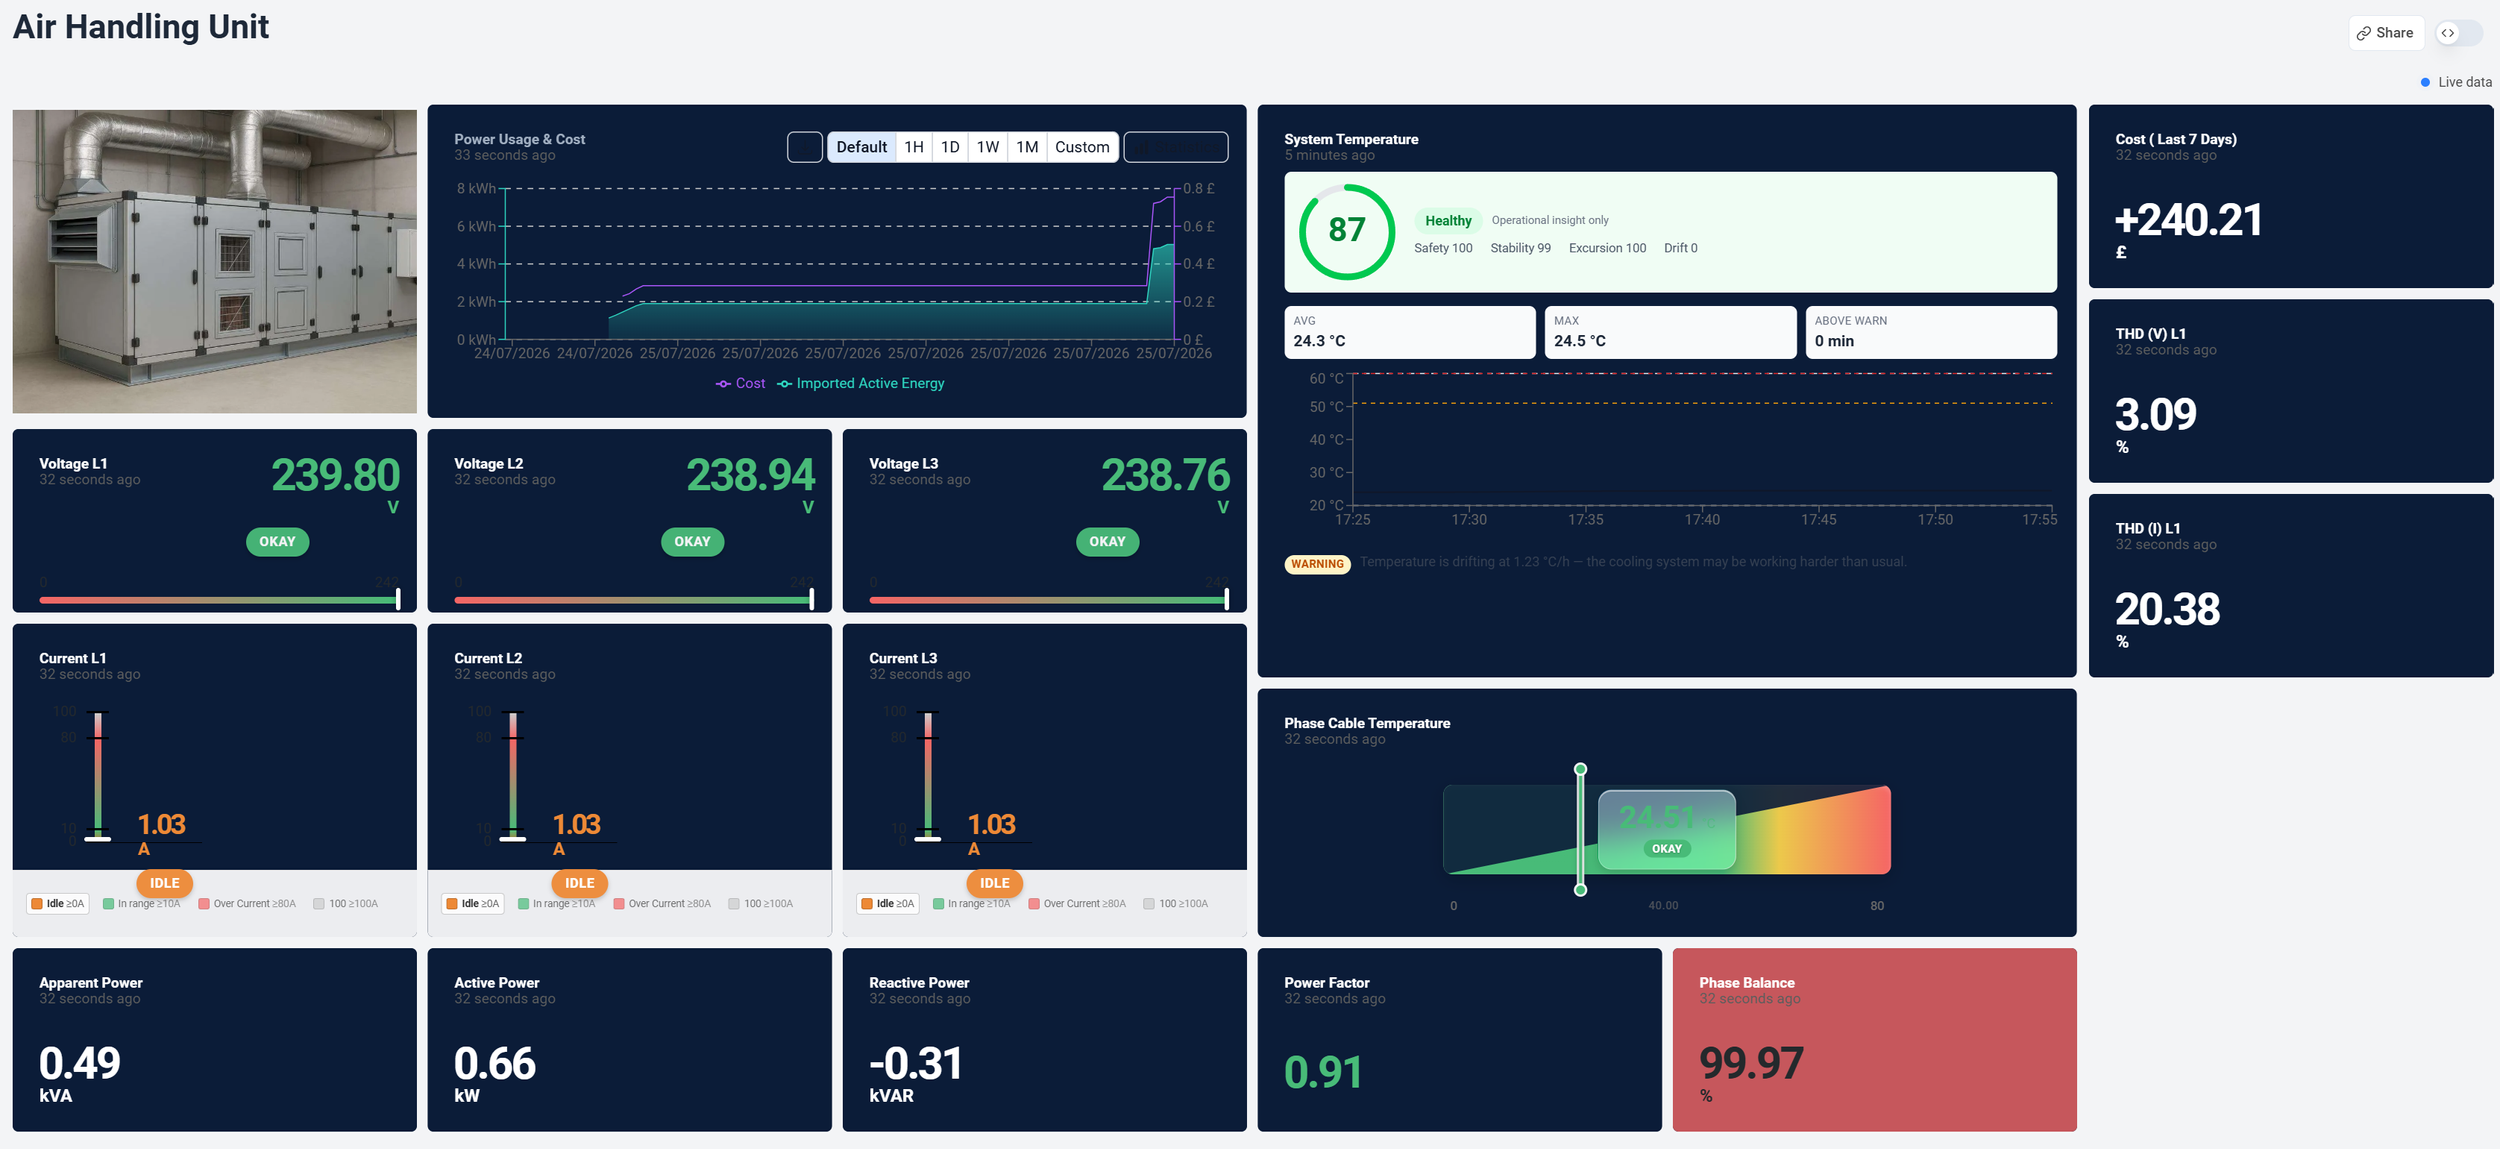
Turn energy efficiency into a team goal. Assign KPIs, track performance, and visualise improvements. Ensuring energy management becomes part of daily operations
Targets and dashboards for teams
Proof of improvement for audits and reporting
Staff KPIs & Accountability