Energy monitoring isn’t a “nice-to-have” anymore - it’s how you stop paying for waste you can’t see
Energy waste is rarely dramatic. It’s usually quiet: a compressor cycling to maintain pressure in a leaky system, a heater stuck on, a motor drawing more current than it should, or a “small” overnight baseload that adds up to thousands over a year.
If you’re managing a site and you don’t have real, granular energy data, you’re basically trying to reduce costs with guesswork. An energy monitoring system turns that guesswork into evidence.
The problem: most sites only see the bill
Many businesses can tell you their monthly spend, maybe even their half-hourly data from the supplier. But that still doesn’t answer the question that matters operationally:
What is using energy, when, and why?
That’s where energy monitoring earns its keep. Instead of waiting for the next invoice, you can see what’s happening on the day and act while it’s still fixable.
Most meters tell you “kWh used”. That’s useful, but it doesn’t answer the question operations people actually care about:
What does this machine cost to run per unit produced?
With real-time energy monitoring, you can build metrics like:
kWh per batch / per cycle
£ per unit manufactured
Energy per shift
What an energy monitoring system actually does (in plain English)
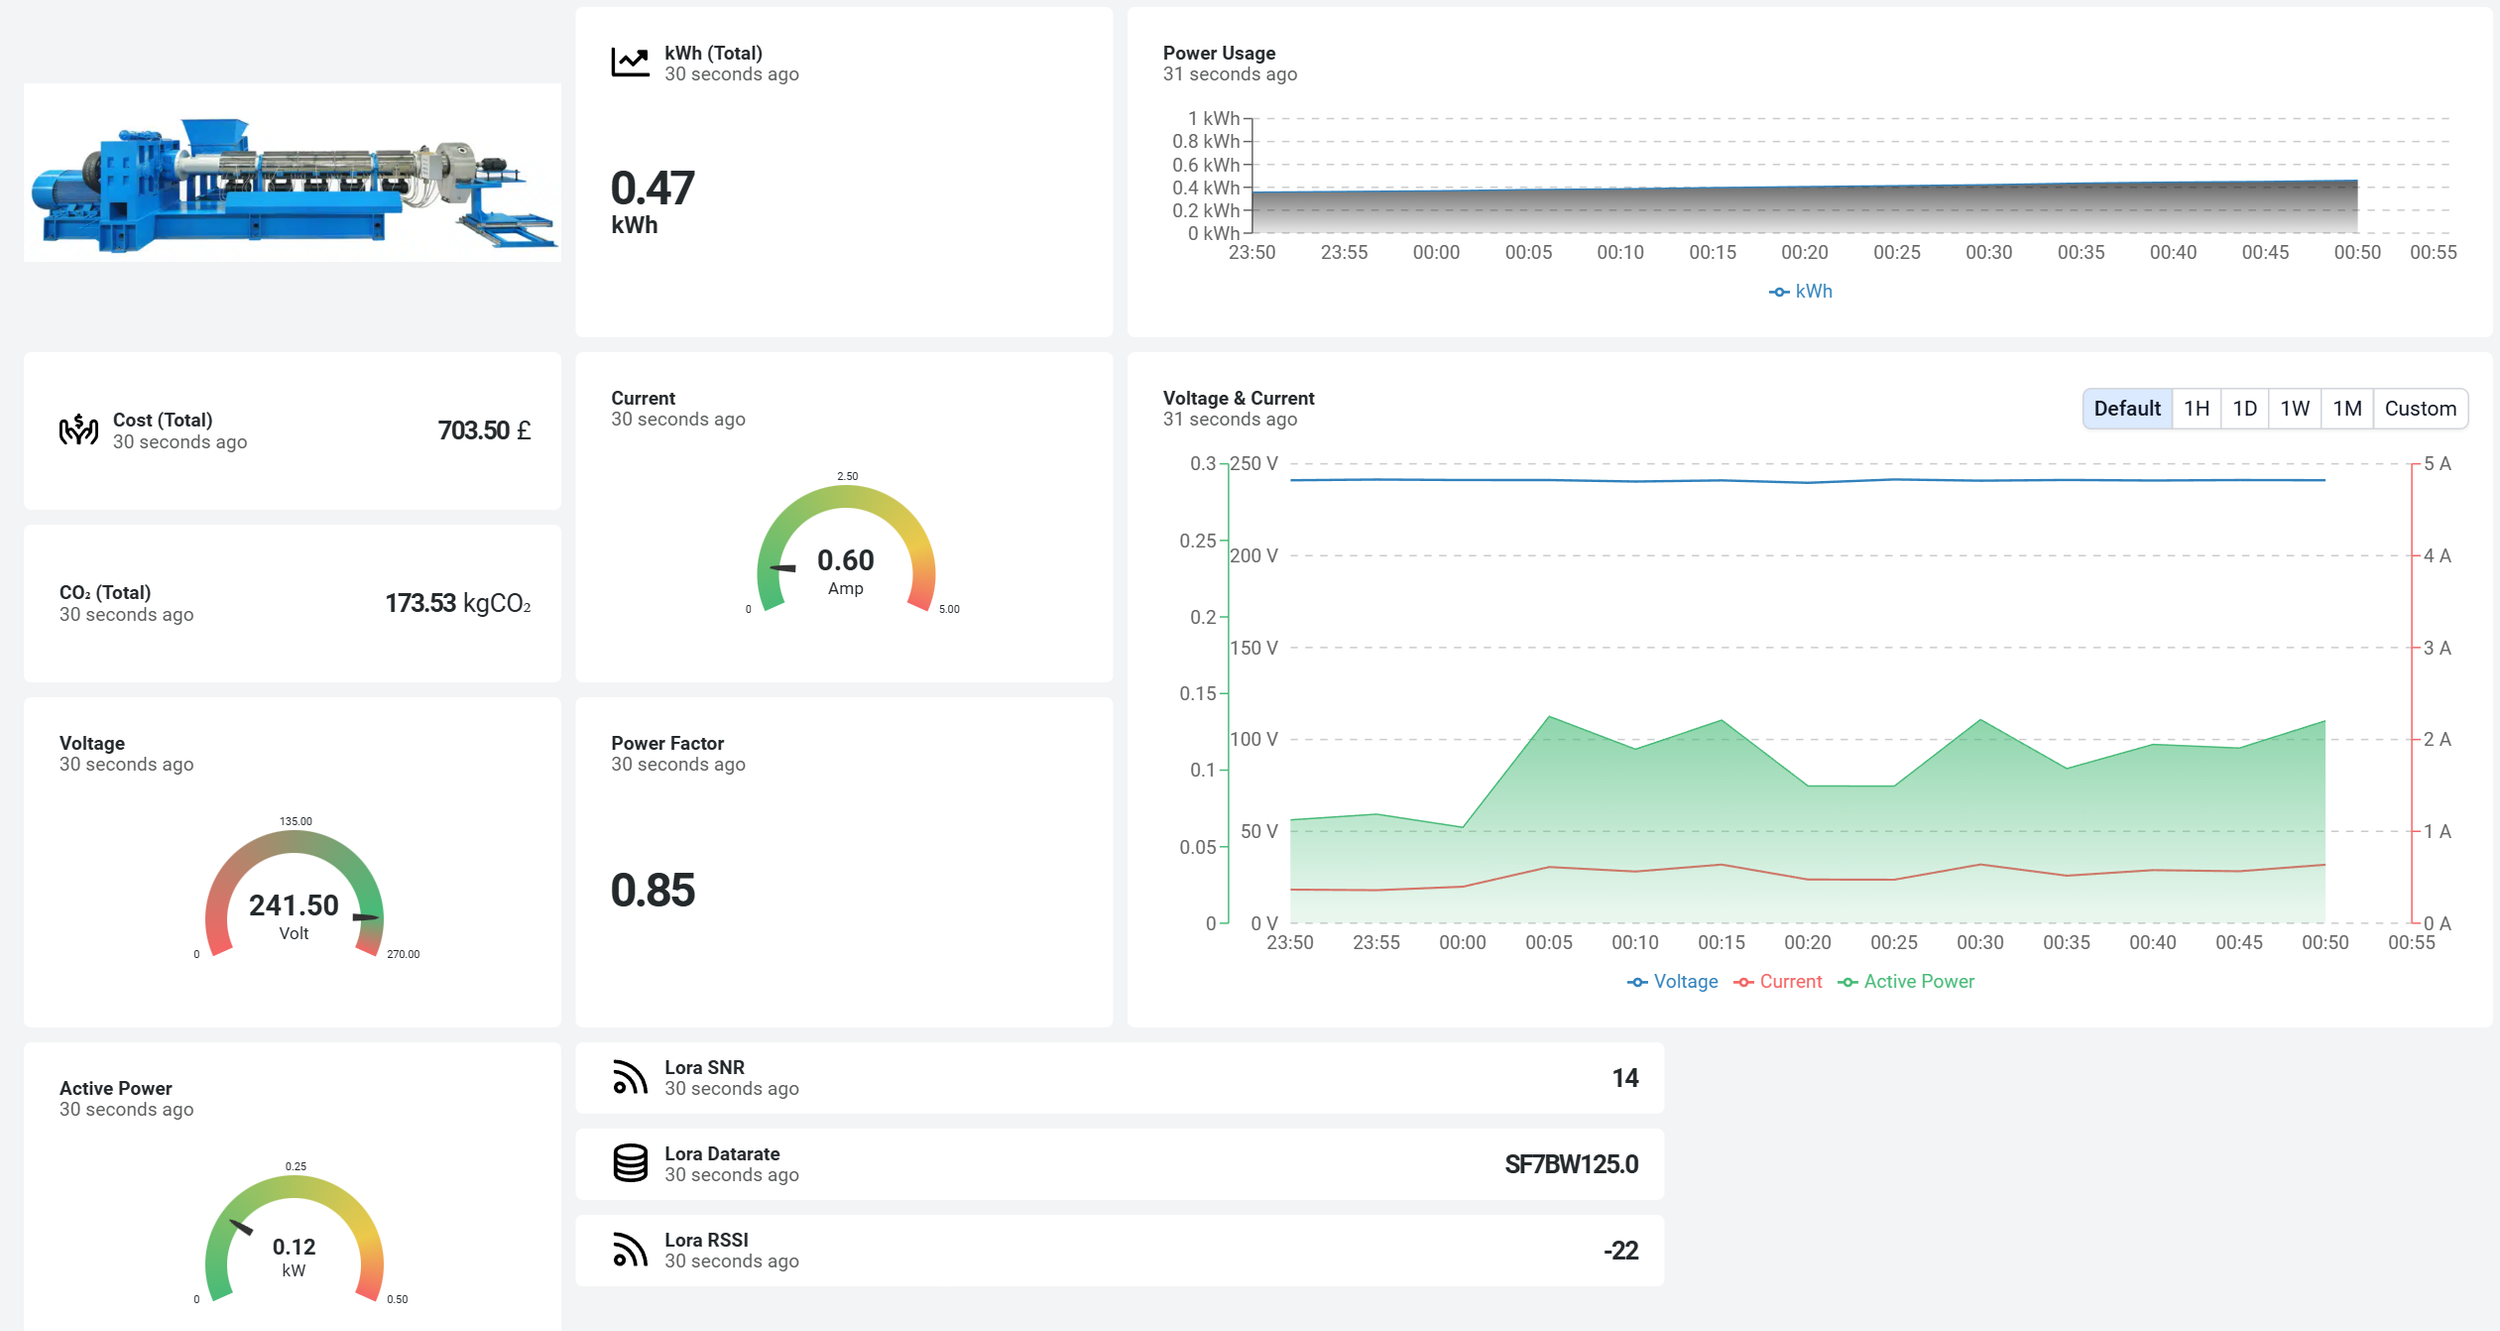
At its simplest, a monitoring system measures energy in the places that matter and turns it into something useful:
Real measurements from distribution boards, machines, processes, or zones
Trends over time to understand the change
Alerts when something behaves differently than normal
Proof that a change actually worked (or didn’t)
It’s not “more data for the sake of it”. It’s the ability to spot waste fast, prioritise what to fix, and measure savings with confidence.
Where the savings really come from
Energy monitoring doesn’t reduce consumption on its own, it gives you the evidence to focus on the few things that usually drive most of the waste. In real sites, the biggest savings tend to come from patterns you can’t see on a monthly bill: an “overnight baseload” that never really switches off, utilities like compressed air and steam/process heat running out of hours or cycling inefficiently and equipment that’s technically working but doing it expensively (oversized motors running lightly loaded, pumps and fans with poor control, refrigeration or plant that’s drifted over time). Good monitoring also exposes electrical inefficiencies that are easy to miss, like poor power factor and high reactive power, unbalanced loads across phases, and peak-demand spikes caused by start-up sequencing or multiple large loads running at once. Once you can see when and where those behaviours happen, you can target the fixes that actually pay back and just as importantly, prove the improvement afterwards with before/after data.
What it’s made of: the three building blocks
Most monitoring setups (good ones, anyway) boil down to three layers:
Measurement
Sub-metering and sensors: power, current, sometimes temperature/pressure/flow depending on the process.Data handling
A platform that stores readings, keeps them clean, and allows comparison (day vs day, shift vs shift, machine vs machine).Visuals + alerts
Dashboards that operators can actually use — plus simple alerts when something changes: “this is higher than normal” or “this machine didn’t switch off”.
If any one of these layers is weak, the system becomes a dashboard nobody opens.
Benefits beyond cost
Savings matter, but the bigger win is operational control. With time-based data you can see when an issue started, verify what a change actually saved, and reduce downtime risk by spotting abnormal patterns early. It also makes decisions easier: you can justify upgrades with evidence rather than opinion, and back up sustainability reporting with credible measurements instead of estimates.
The Enerlytix difference
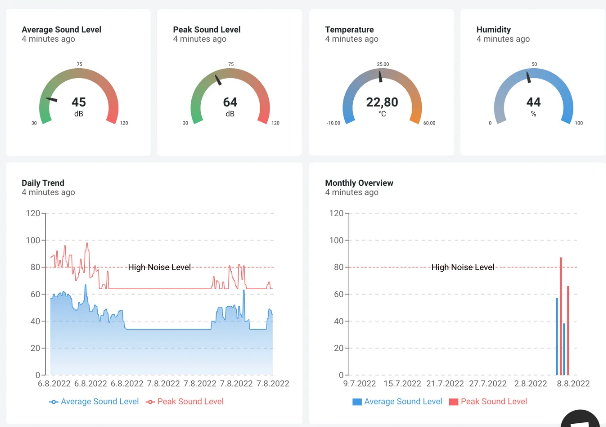
Our platform, Enerlytix-Scout turns energy from a monthly surprise into something you can manage daily. It highlights waste quickly, makes improvements measurable and builds the evidence you need for sustainability reporting and compliance work like ISO 50001 energy management and ESOS. As your needs grow, Scout also integrates other sensors like air quality, cold storage temperature/humidity, occupancy. Giving you get one central overview of your facility.