Complete Monitoring for Comfort, Health and Efficiency

Manage indoor air quality across your whole estate from one dashboard. Our wireless multi-room monitoring scales from a few sensors to hundreds across multiple sites, tracking CO₂, particulate pollution (dust/fumes), VOCs, temperature and humidity. Set site-specific thresholds, receive alerts, compare performance across buildings, and generate reports for facilities teams, so standards are consistent everywhere.
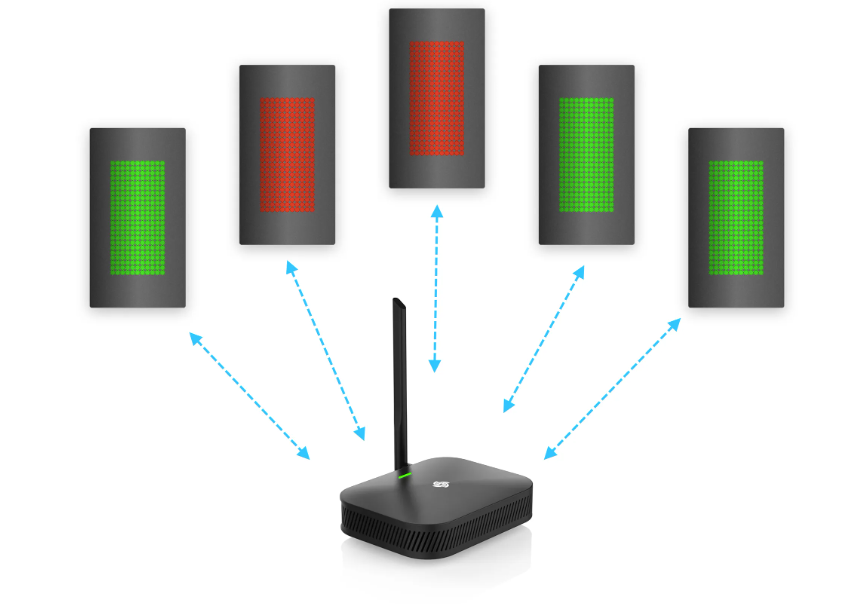
Wireless signal booster emitting signals to multiple batteries showing charge levels, with some fully charged and others partially charged.

Continuously Monitoring…

Cloud icon with an X inside

CO₂ & VOC

Stylized logo of a letter E within a rounded shield shape, navy blue color.

Dust & Particles

An icon of a loudspeaker with a speaker symbol, representing sound or volume.

Noise & Loudness

Thermometer icon indicating temperature.

Temperature

A stylized blue water droplet icon with three horizontal lines inside

Humidity

Close-up of a blue integrated circuit or chip with multiple pins.

Battery or USB Powered

Icon of a light bulb

Light

Easy to Visualise …

Logo for Enerlytix Scout featuring a stylized binoculars icon with a gradient circular border, and the text 'Enerlytix Scout' in bold, with 'Enerlytix' in dark blue and 'Scout' in gradient purple and blue.
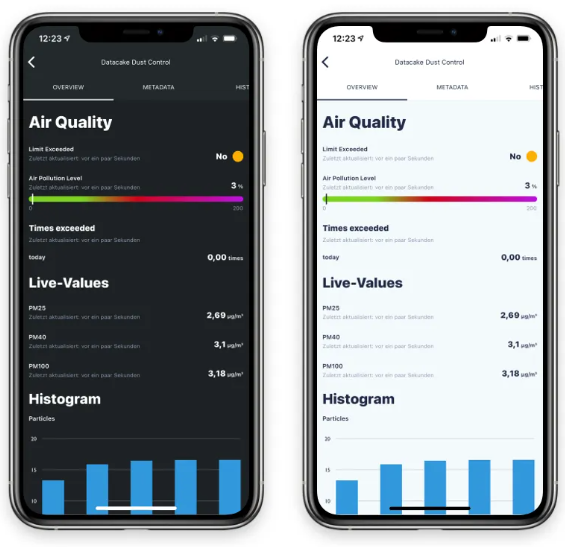
Side-by-side comparison of two smartphone screens displaying air quality monitoring app with data on dust control, air pollution levels, live sensor values for PM2.5, PM4, and PM10, and a histogram of particle counts.
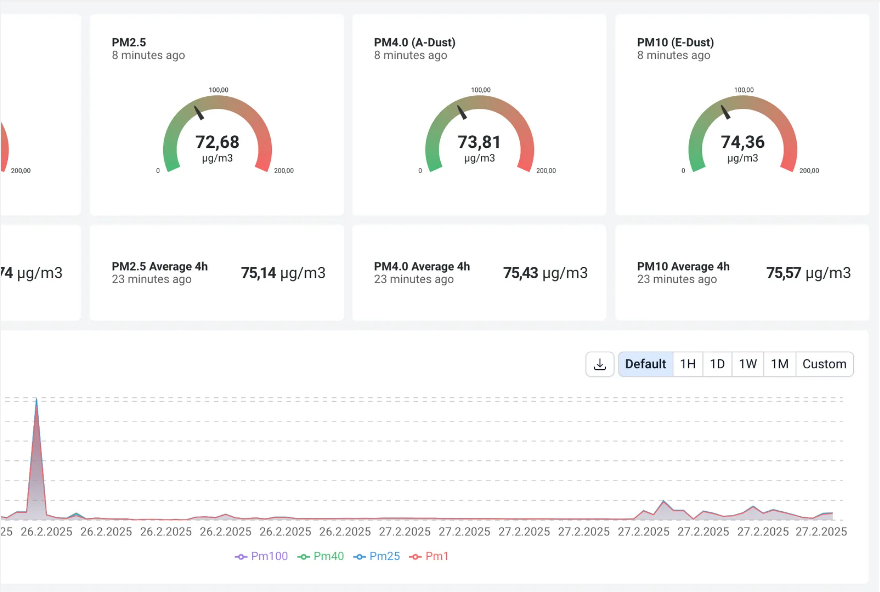
Air quality monitoring dashboard displaying real-time levels of PM2.5, PM4.0, and PM10 particles with gauges, hourly averages, and a trend graph of pollutant levels over several days.
Abstract digital artwork featuring glowing streaks of blue and pink light with bokeh effects
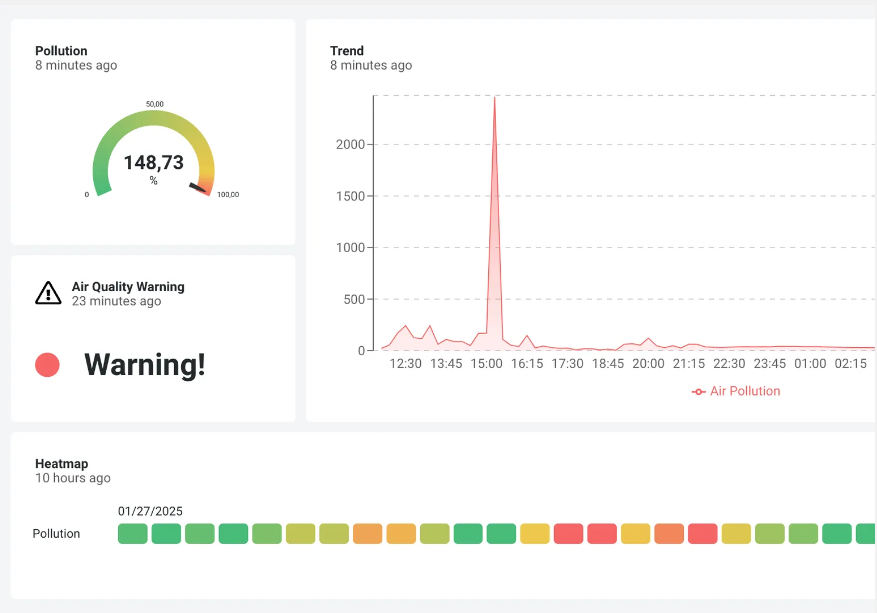
Dashboard displaying air quality data, including a pollution gauge at 148.73%, a warning icon indicating poor air quality 23 minutes ago, a line graph showing a spike in air pollution around 3:00 PM, and a heatmap with pollution levels over the past 10 hours.
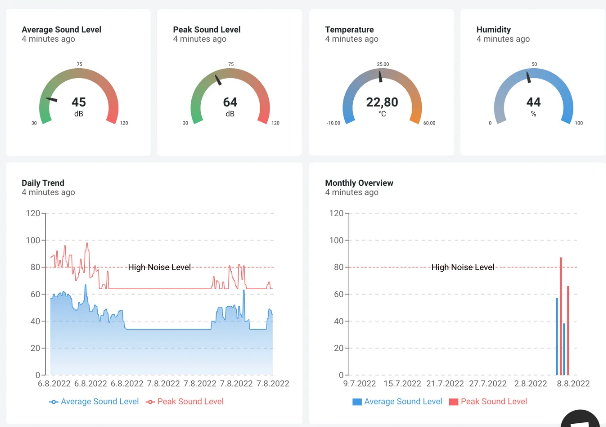
Dashboard showing environmental and sound level data including average sound level 45 dB, peak sound level 64 dB, temperature 22.80°C, humidity 44%. Additional charts display daily sound level trends and monthly overviews with high noise levels.

Example Applications

Education Facilities

Multi-level shopping mall with various stores, shoppers, escalators, and yellow structural support beams.

Shopping Centres

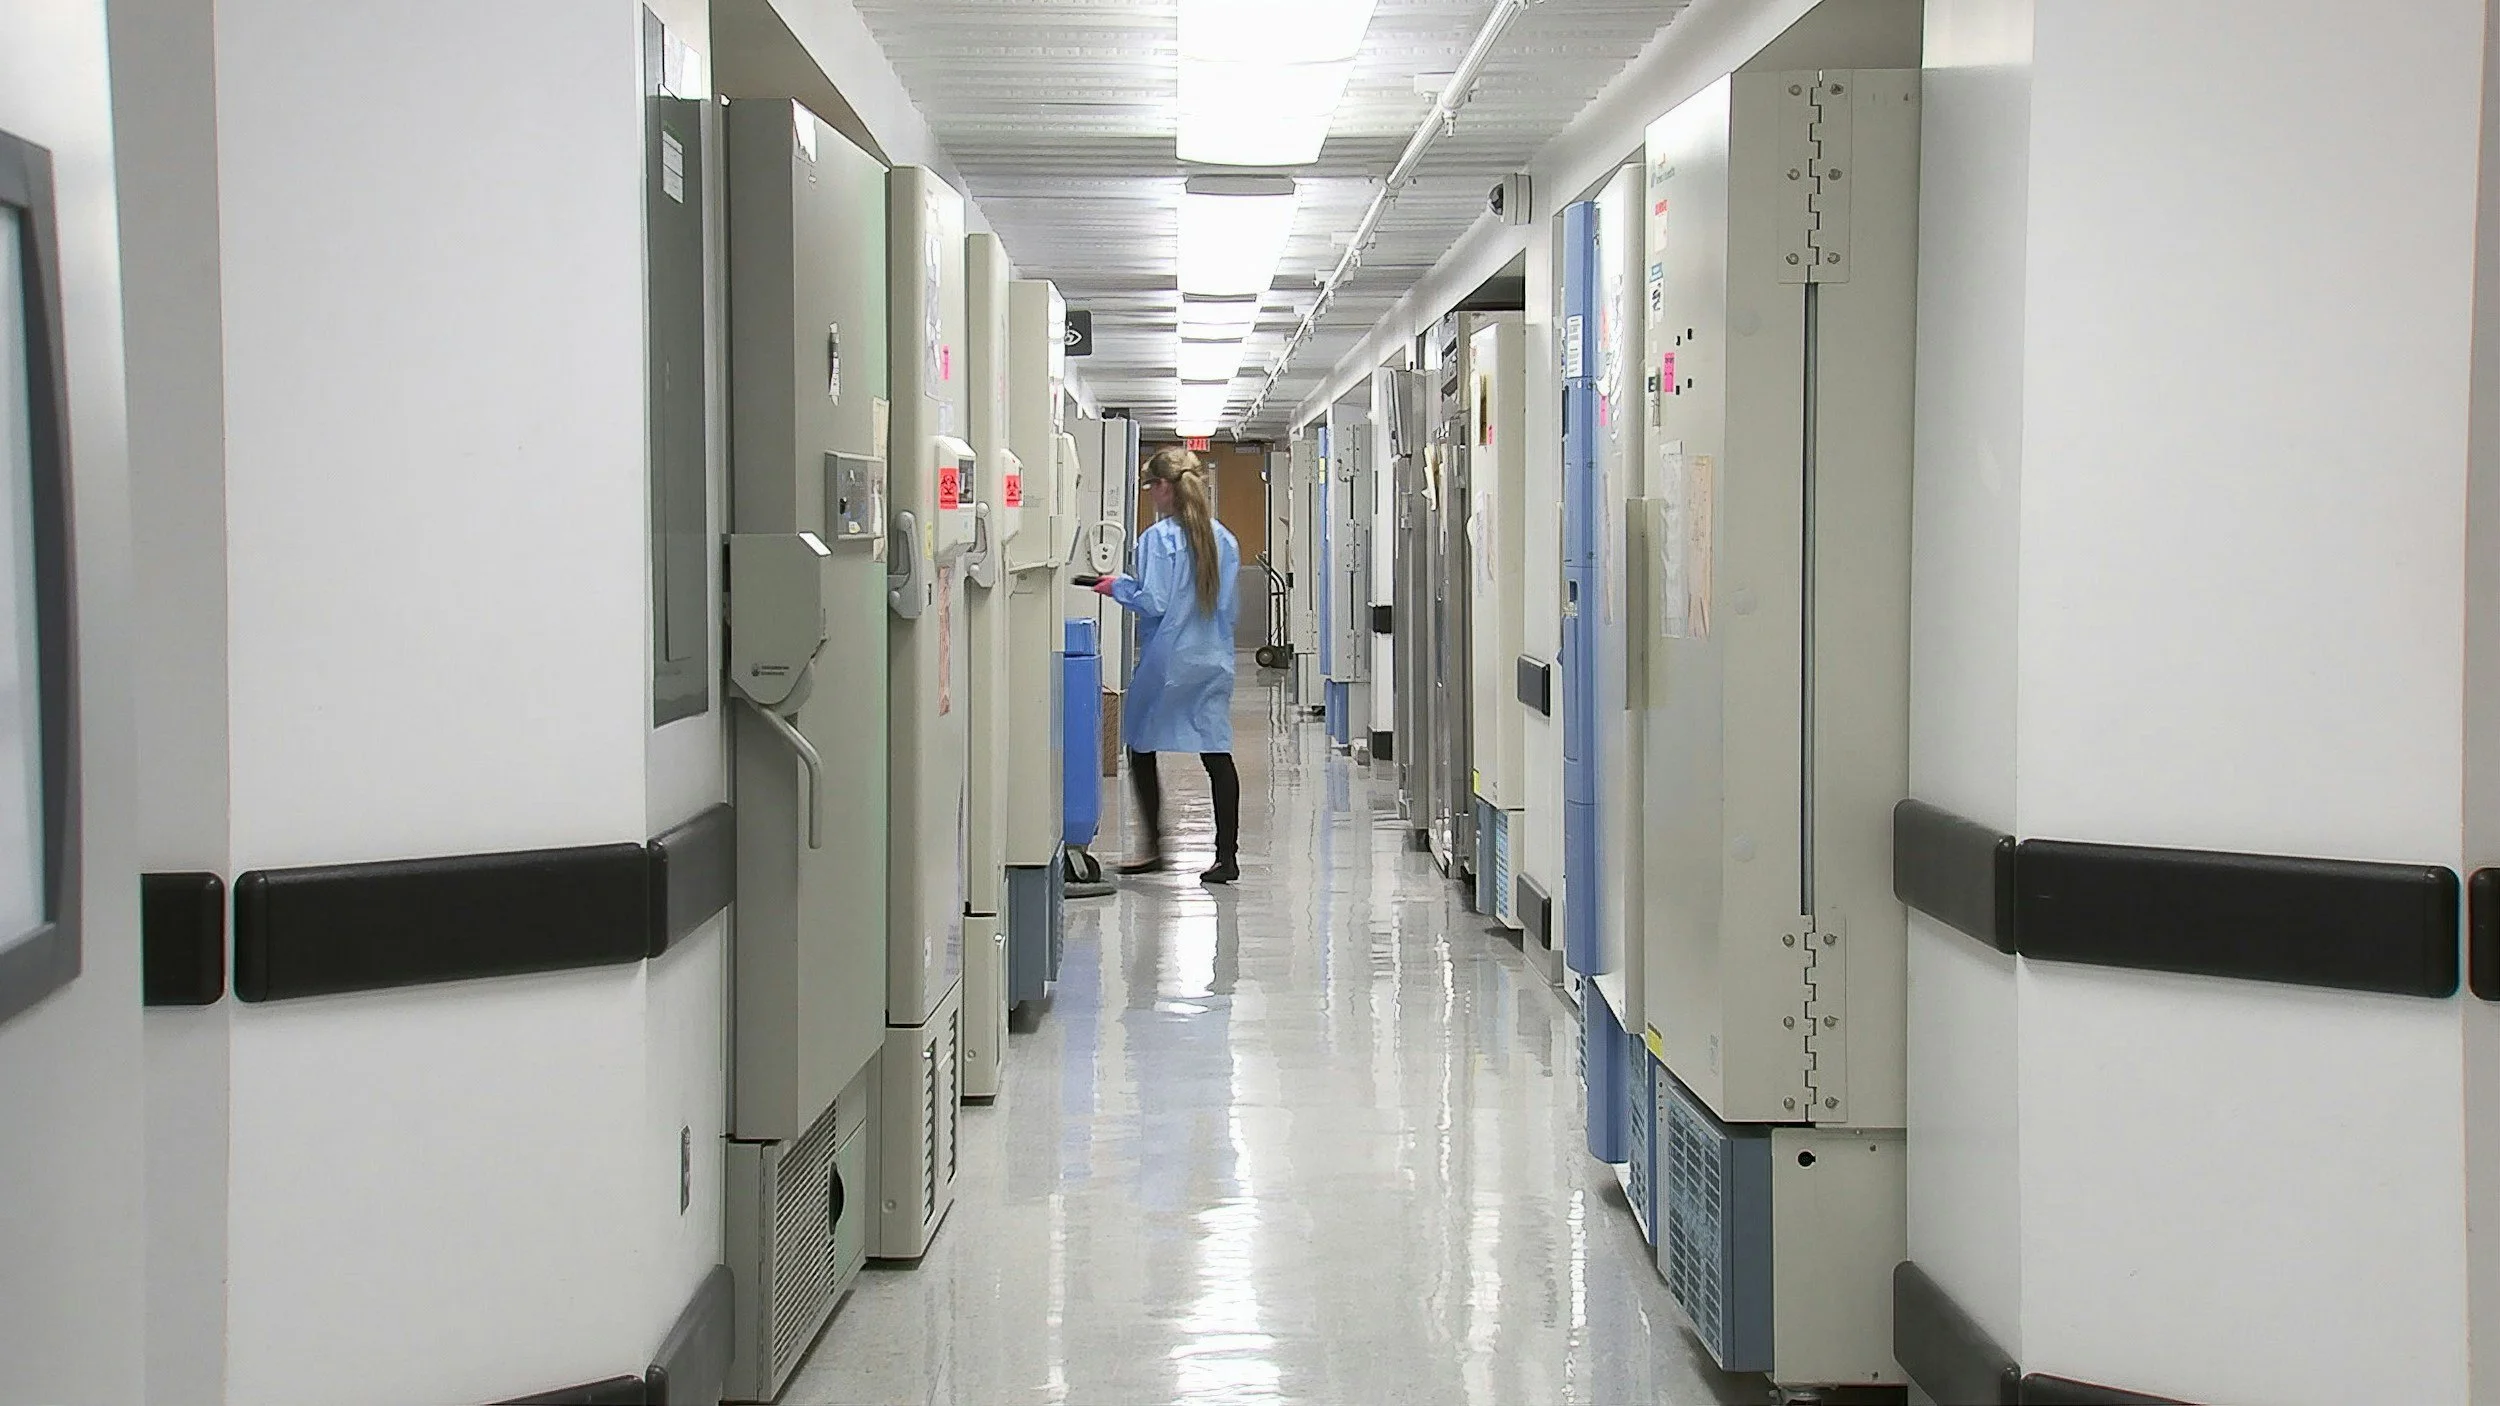
Long hospital corridor with medical equipment and cabinets on both sides. A healthcare worker in blue scrubs and black boots is walking and using a smartphone.

Hospitals & Healthcare

Server racks and data center equipment with 'imgIX' logos.

Server Rooms

A person welding metal with sparks flying, wearing protective gloves and helmet in a workshop.

Industrial & Warehousing

A group of people working together at a conference table in a modern office conference room.

Work Spaces