Dark blue background with no visible objects or details.

Every kilowatt accounted for.
All waste identified.
Every saving yours.

Device-level visibility of every machine, circuit and building system in real time

Abstract digital background with flowing neon blue and pink light streaks and glowing particles.

With energy monitoring comes

lower electricity bills

Bring live energy data into one place, at circuit level, with Enerlytix-Scout dashboards and trends that make it easier to spot waste and stay in control.

Logo with a stylized face wearing glasses inside a circular gradient border and the words 'Enerlytx Scout' in gradient text to the right.

Remove the guesswork

24/7
Continuous monitoring
Automated data collection — no one-off surveys or manual readings
1
Platform for everything
Energy, temperature, air quality and equipment runtime — all in one dashboard
Multi-site
Any scale, any location
From a single factory floor to multiple sites across the UK
No WiFi
Independent of your IT
Wireless LTE devices — nothing connects to your network
See exactly how sites, equipment and processes behave over time
Highlight waste, inefficiencies and emerging issues before they cost you
Evidence-based reporting ready for ISO 50001, ESOS and ESG
Reduce energy costs

See exactly what each machine and circuit costs to run. Identify idle draw, out of hours waste and inefficient equipment before it costs you more.

Real-time visibility

Live data updated every 60 seconds across every monitored device. Know what is happening on your site right now, not at the end of the month when the bill arrives.

Hit sustainability targets

Track CO2 emissions per machine and across your whole site. Export data for ESOS compliance, ESG reporting and net zero evidence.

Machine utilisation

Know which machines are actually running versus sitting idle. Understand shift patterns, overtime consumption and production efficiency from your energy data.

Alerts and anomaly detection

Get notified when a machine draws more than expected, runs outside operating hours or a cable temperature rises above threshold. Catch problems before they become failures.

Compliance evidence

Measured circuit-level data supports ESOS assessments, ISO 50001 certification and BICS applications. Evidence based on real measurements, not estimates.

‍ ‍

No WiFi, no IT involvement, no maintenance. Just real-time visibility of every machine and circuit on your site.

Wireless. Secure. Live in hours

Gateway
Tap a sensor to see live readings

How It Works

From first contact to live dashboard, we handle everything.

STEP 01
Get in Touch
Tell us about your site and what you want to monitor. We'll ask the right questions to understand your setup and recommend the best solution.
STEP 02
System Design
We select the right devices for your setup and put together a clear proposal covering hardware, installation and ongoing software costs. No hidden extras.
STEP 03
Installation
We install the hardware on site with minimal disruption to your operations, working around your schedule. No need to touch your IT network or WiFi.
STEP 04
Live Dashboard
Your Enerlytix-Scout dashboard goes live with your data straight away. We walk you through it, set up your alerts and stay on hand to support you as you get started.
Optional
Add PowerPro
Let our power engineers take it further. We review your data and utility bills, quantify the cost of any waste we find and give you the support to act on it.
Live
kWh this month
141,840kWh
+4.1% vs last month
Cost this month
£38,297
+£1,240 vs last month
Live site power
812kW
Updated just now
Alerts
HVAC — running out of hours
Consumption detected outside operating hours
~£340/yr waste
Compressor 2 — overnight consumption
Unusual energy use detected outside production
~£890/yr waste
Site consumption up 4% this month
Recommend reviewing recent changes to site operations
Investigate
CNC Mill 1
Running · 84% utilisation
184kW
Compressor 1
Running · 91% utilisation
160kW
Injection Moulder
Running · 67% utilisation
129kW
Welding Bay
Idle — drawing power
9kW
20%
of UK business energy spend is wasted through inefficiency
Carbon Trust
10%+
Savings potential identified through energy management measures
Gov.uk
= 5% sales
A 20% energy saving has the same bottom-line impact as a 5% increase in sales
Gov.uk / Make UK
Estimate your savings
Enter your annual electricity spend and sector to see what energy monitoring could save your business.
Please enter your annual electricity spend
Estimated annual savings
Conservative
10% saving
Typical
15% saving
Potential
20% saving
Estimated CO2 saved
tonnes per year
Bottom-line equivalent
of additional sales
Estimates based on Carbon Trust and Gov.uk benchmarks for UK businesses. Actual savings vary by site, equipment and how actively data is acted on.
Want a site-specific estimate? Talk to our engineers →
Free Pilot Limited spaces available

See exactly what your machines
are costing you. For free.

Get monitoring kit onto your machines and see real live energy data on the Scout platform — no contract or commitment.

How it works

1

Get in touch

We learn about your machines, spec the right kit for your setup, and agree the best way to get you live.

2

We get your kit to you

Sensors and a Scout gateway tailored to your machines. We'll be in touch to arrange an on-site visit.

3

See live data from your own machines

Log into your Scout dashboard and start seeing exactly what each machine costs to run.

4

Keep going or walk away

Continue with a subscription or return the kit. No pressure, no commitment.

Your dashboard

Enerlytix Scout — Air Compressor, Bay 3

Active Power

11.9 kW

Cost today

£21.34

kWh today

86.4

CO2 today

17.8 kg

Power Factor POWER HUB

Reactive Power POWER HUB

kVAr

Voltage POWER HUB

V

Peak Demand POWER HUB

kVA

Unlock Power Factor, Reactive Power, Voltage and Peak Demand by upgrading to a Power Hub. Poor power factor alone can cost manufacturers thousands annually.

Live machine data
Machine Status Power kWh Cost

Ready to see your data?

Get in touch. We'll work out the right setup for your machines and take it from there.

Contact us

Limited pilot spaces  ·  No commitment

Data point CT Clamp Power Hub
Current (A) ✓ Measured ✓ Measured
Energy consumption (kWh) & CO₂ ~ Calculated ✓ Measured
On / Off status, run time, utilisation ✓ Measured ✓ Measured
Cable temperature (°C) ✓ Measured ✓ Measured
Voltage per phase (V) ✓ Measured
Active power (kW) ~ Calculated ✓ Measured
Power factor (PF) ✓ Measured
Reactive power (kVAr) ✓ Measured
Apparent power (kVA) ✓ Measured
Frequency (Hz) ✓ Measured
Harmonic distortion (THD %) ✓ Measured
Max demand current / power ✓ Measured
Reactive energy (kVArh) ✓ Measured
Current (A)
CT Clamp✓ Measured
Power Hub✓ Measured
Energy consumption (kWh) & CO₂
CT Clamp~ Calculated
Power Hub✓ Measured
On / Off status, run time, utilisation
CT Clamp✓ Measured
Power Hub✓ Measured
Cable temperature (°C)
CT Clamp✓ Measured
Power Hub✓ Measured
Voltage per phase (V)
CT Clamp
Power Hub✓ Measured
Active power (kW)
CT Clamp~ Calculated
Power Hub✓ Measured
Power factor (PF)
CT Clamp
Power Hub✓ Measured
Reactive power (kVAr)
CT Clamp
Power Hub✓ Measured
Apparent power (kVA)
CT Clamp
Power Hub✓ Measured
Frequency (Hz)
CT Clamp
Power Hub✓ Measured
Harmonic distortion (THD %)
CT Clamp
Power Hub✓ Measured
Max demand current / power
CT Clamp
Power Hub✓ Measured
Reactive energy (kVArh)
CT Clamp
Power Hub✓ Measured
✓ Measured Direct hardware measurement
~ Calculated Derived from nominal supply voltage — acceptable for most applications
  Not available

Devices & Data

Enerlytix PowerPro

Your power engineering team.
On your side. Every day.

PowerPro puts our power engineers alongside your team, reviewing your energy and power quality data, identifying what it is costing you and telling you exactly what to do about it.

Monitored every 60 seconds

Your data updates continuously. We review it regularly and flag anything that needs attention before it costs you money.

Waste quantified in pounds

We review your site data and utility bills, help you understand what the numbers mean and quantify the cost of any waste we find.

Action, not just analysis

When we identify an issue we tell you what to do about it. We can manage the solution end to end.

An extension of your team

For businesses without a dedicated electrical engineer on site, PowerPro gives you that expertise without the headcount.

What PowerPro covers

Everything in your data, explained.

We review your site data and utility bills, tell you what it means in plain English and quantify the cost of any waste we find. When something needs fixing we give you the support to act on it.

Power quality analysis and cost impact
Electricity bill review and network charge analysis
Supply quality and voltage review
Maximum demand and capacity charge analysis
Idle and out of hours energy waste
Machine utilisation and running hours
Cable temperature and overload alerts
Clear findings with financial impact in pounds
Business case for any recommended corrective works
Find out more about PowerPro
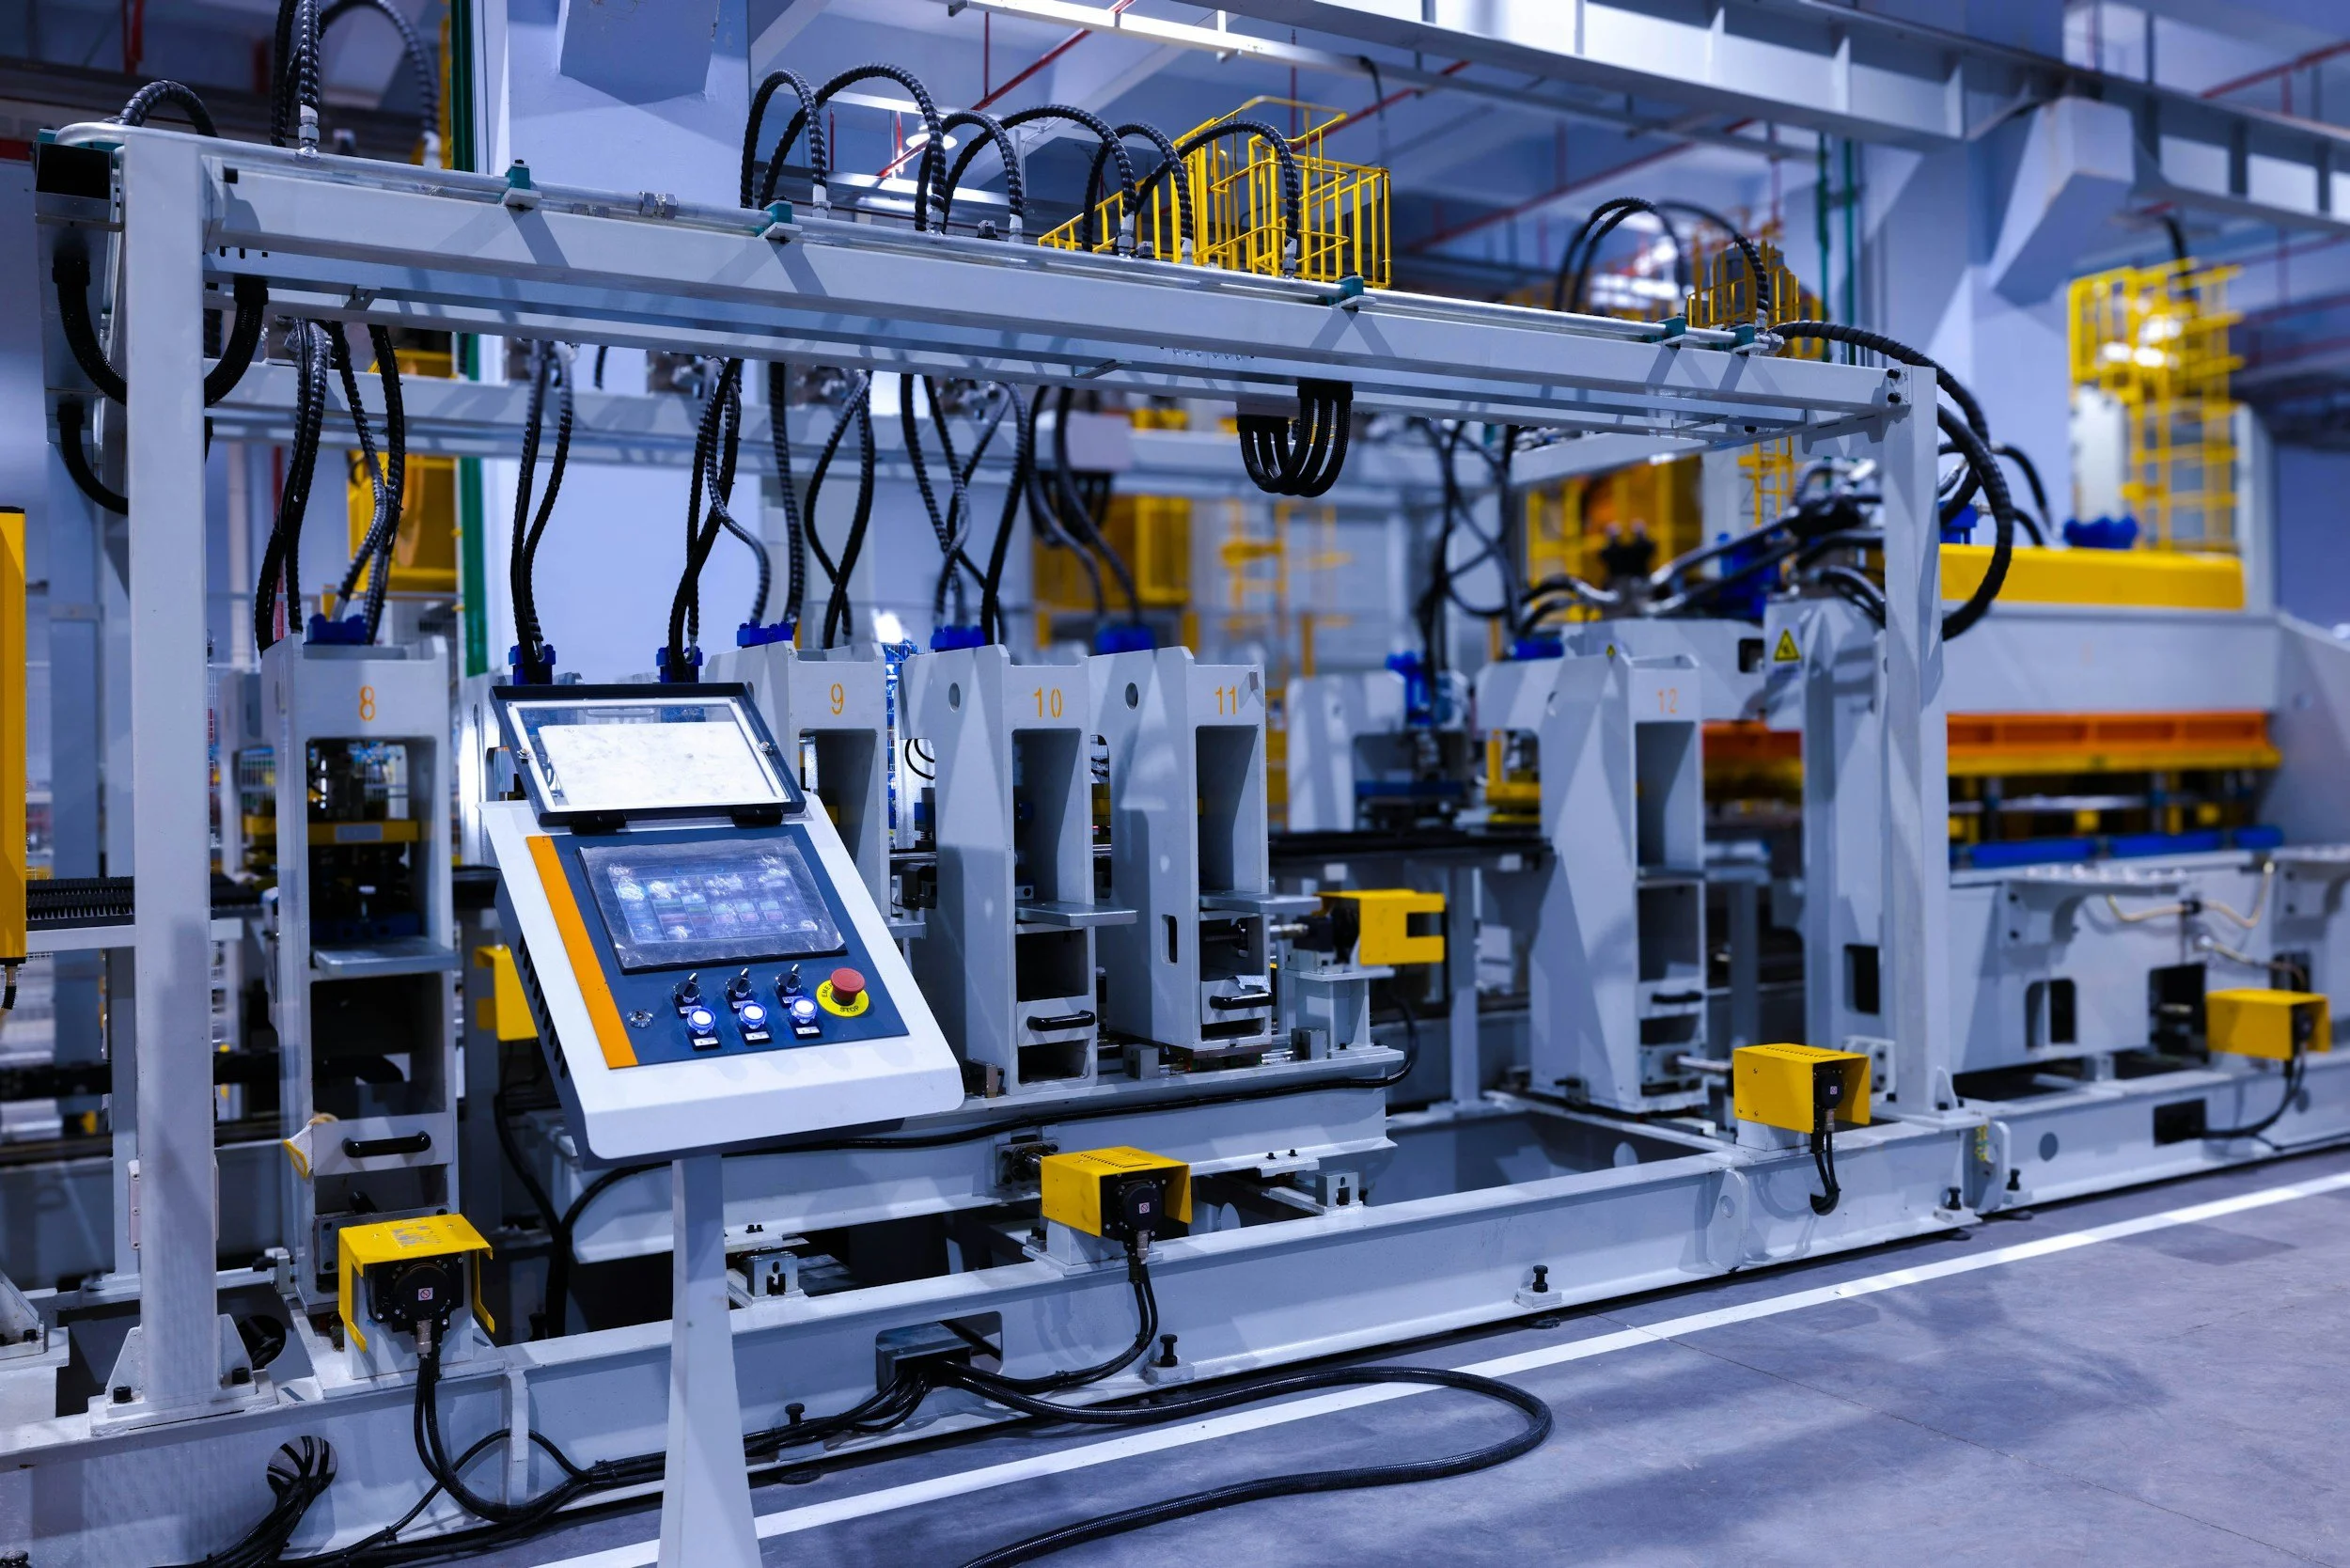
Industrial manufacturing equipment with control panel and interconnected machinery in a factory setting.

Who is it For?

We help organisations across sectors — from SMEs to large production sites — who face rising costs, tighter regulations, and increasing pressure to do more with less.

High Energy Bills
UK non-domestic energy prices have risen sharply. Most companies only see one whole-site meter, making it impossible to pinpoint waste. Enerlytix-Scout gives you machine-level visibility so you can cut costs where it really matters.
Electrical Capacity Limits
Many sites are unable to run all equipment at once without expensive grid upgrades costing tens of thousands. Enerlytix shows your live combined demand vs. supply capacity, helping you manage loads intelligently and avoid overspend.
Reactive Power Charges
Poor power factor or harmonics quietly add to your bills. Enerlytix highlights power quality issues in real time so they can be corrected before costs build up.
Frequent Breakdowns
Unplanned downtime costs more than energy. By tracking motor currents and temperatures, Enerlytix spots early signs of failure and helps shift maintenance from reactive to proactive.
Compliance Pressure
Government legislation is continuously evolving — from ESOS to SECR and Scotland's Section 63. Enerlytix provides the data and reporting to meet requirements with confidence.
Net-Zero & Sustainability Targets
Many procurement frameworks and supply chains now require ISO 50001 alignment or demonstrable CO₂ reduction. Enerlytix helps you hit targets, prove performance and stay competitive.

Same Platform,
Endless Capabilities

One system. Multiple applications. All managed from your Enerlytix-Scout dashboard.

Running water from a tap
Water Usage & Legionella Monitoring

Discreet clamp-on sensors fit to the outside of pipework with no interruption to your water supply. Continuously log temperatures at key points and alert when conditions drift into higher-risk ranges.

  • Reduce routine manual temperature rounds and paperwork
  • Support compliance with COSHH, ACOP L8 and HSG274
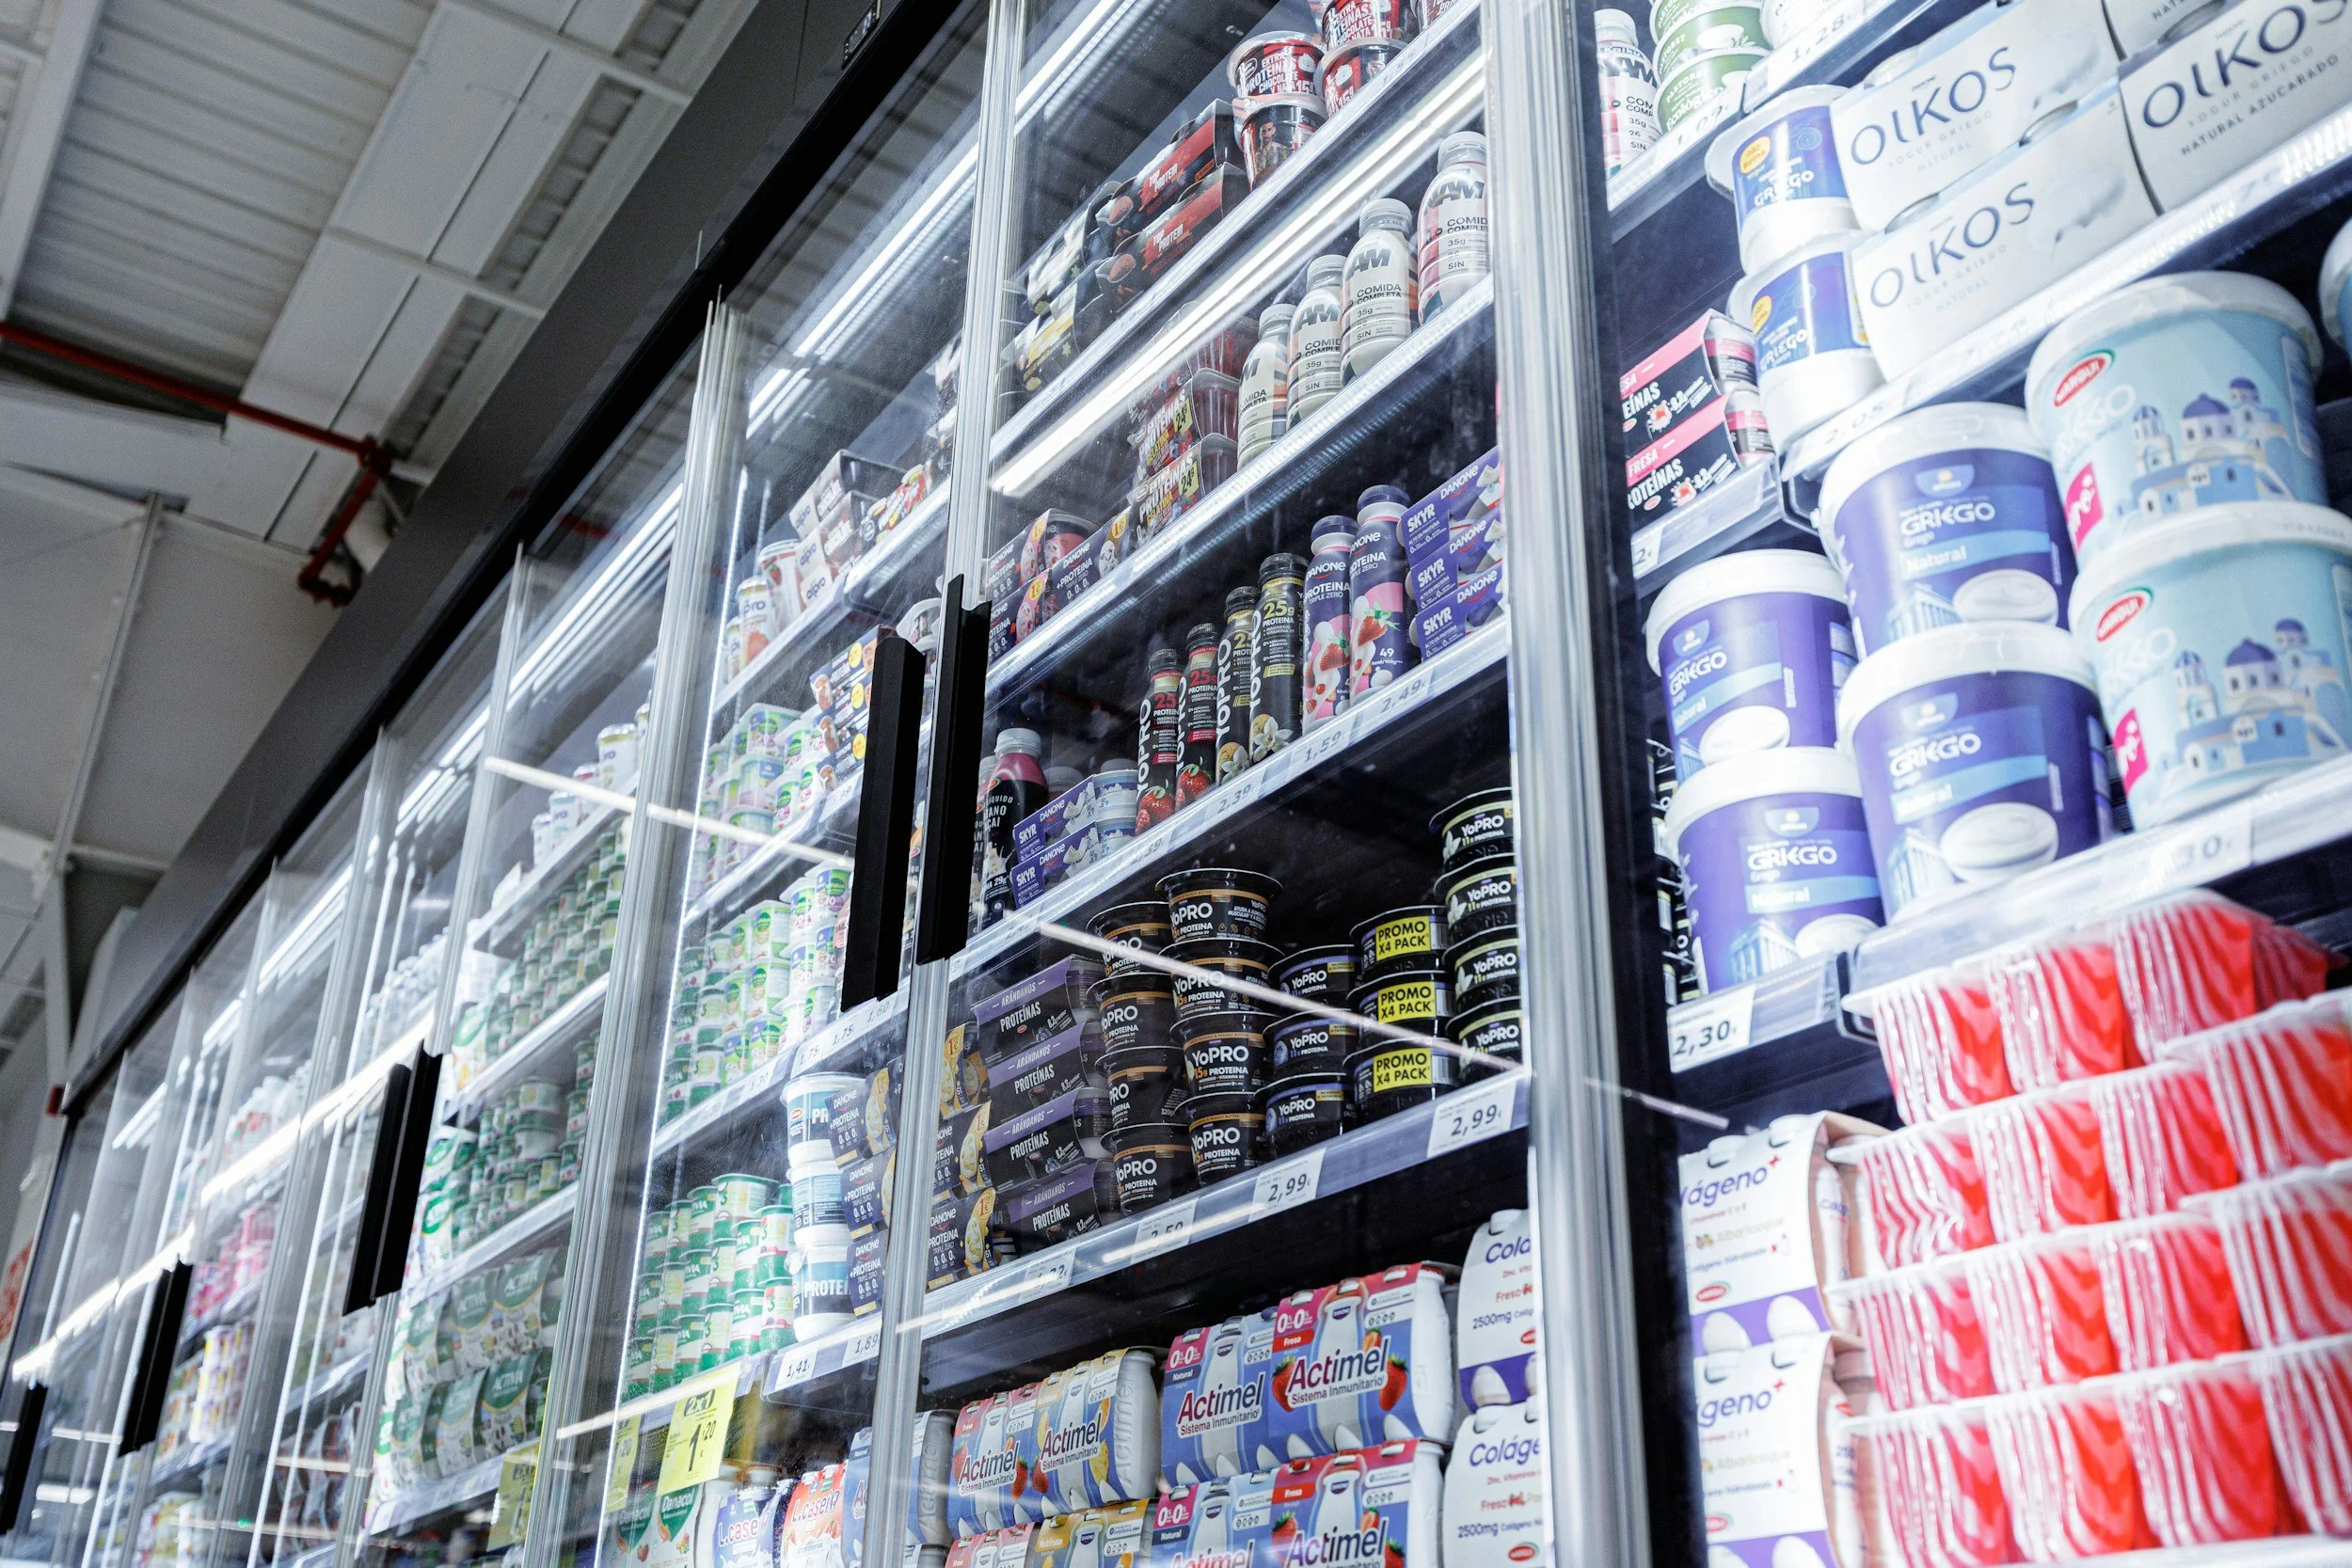
Temperature monitoring in cold storage
Temperature & Environmental Monitoring

Sensors placed inside fridges, freezers and cold rooms with no disruption to operations. Continuously log temperature and send instant alerts if readings drift outside set limits — ideal for food and pharmaceuticals.

  • Less manual checking, lower risk of spoilage and waste
  • Consistent records for compliance and inspections

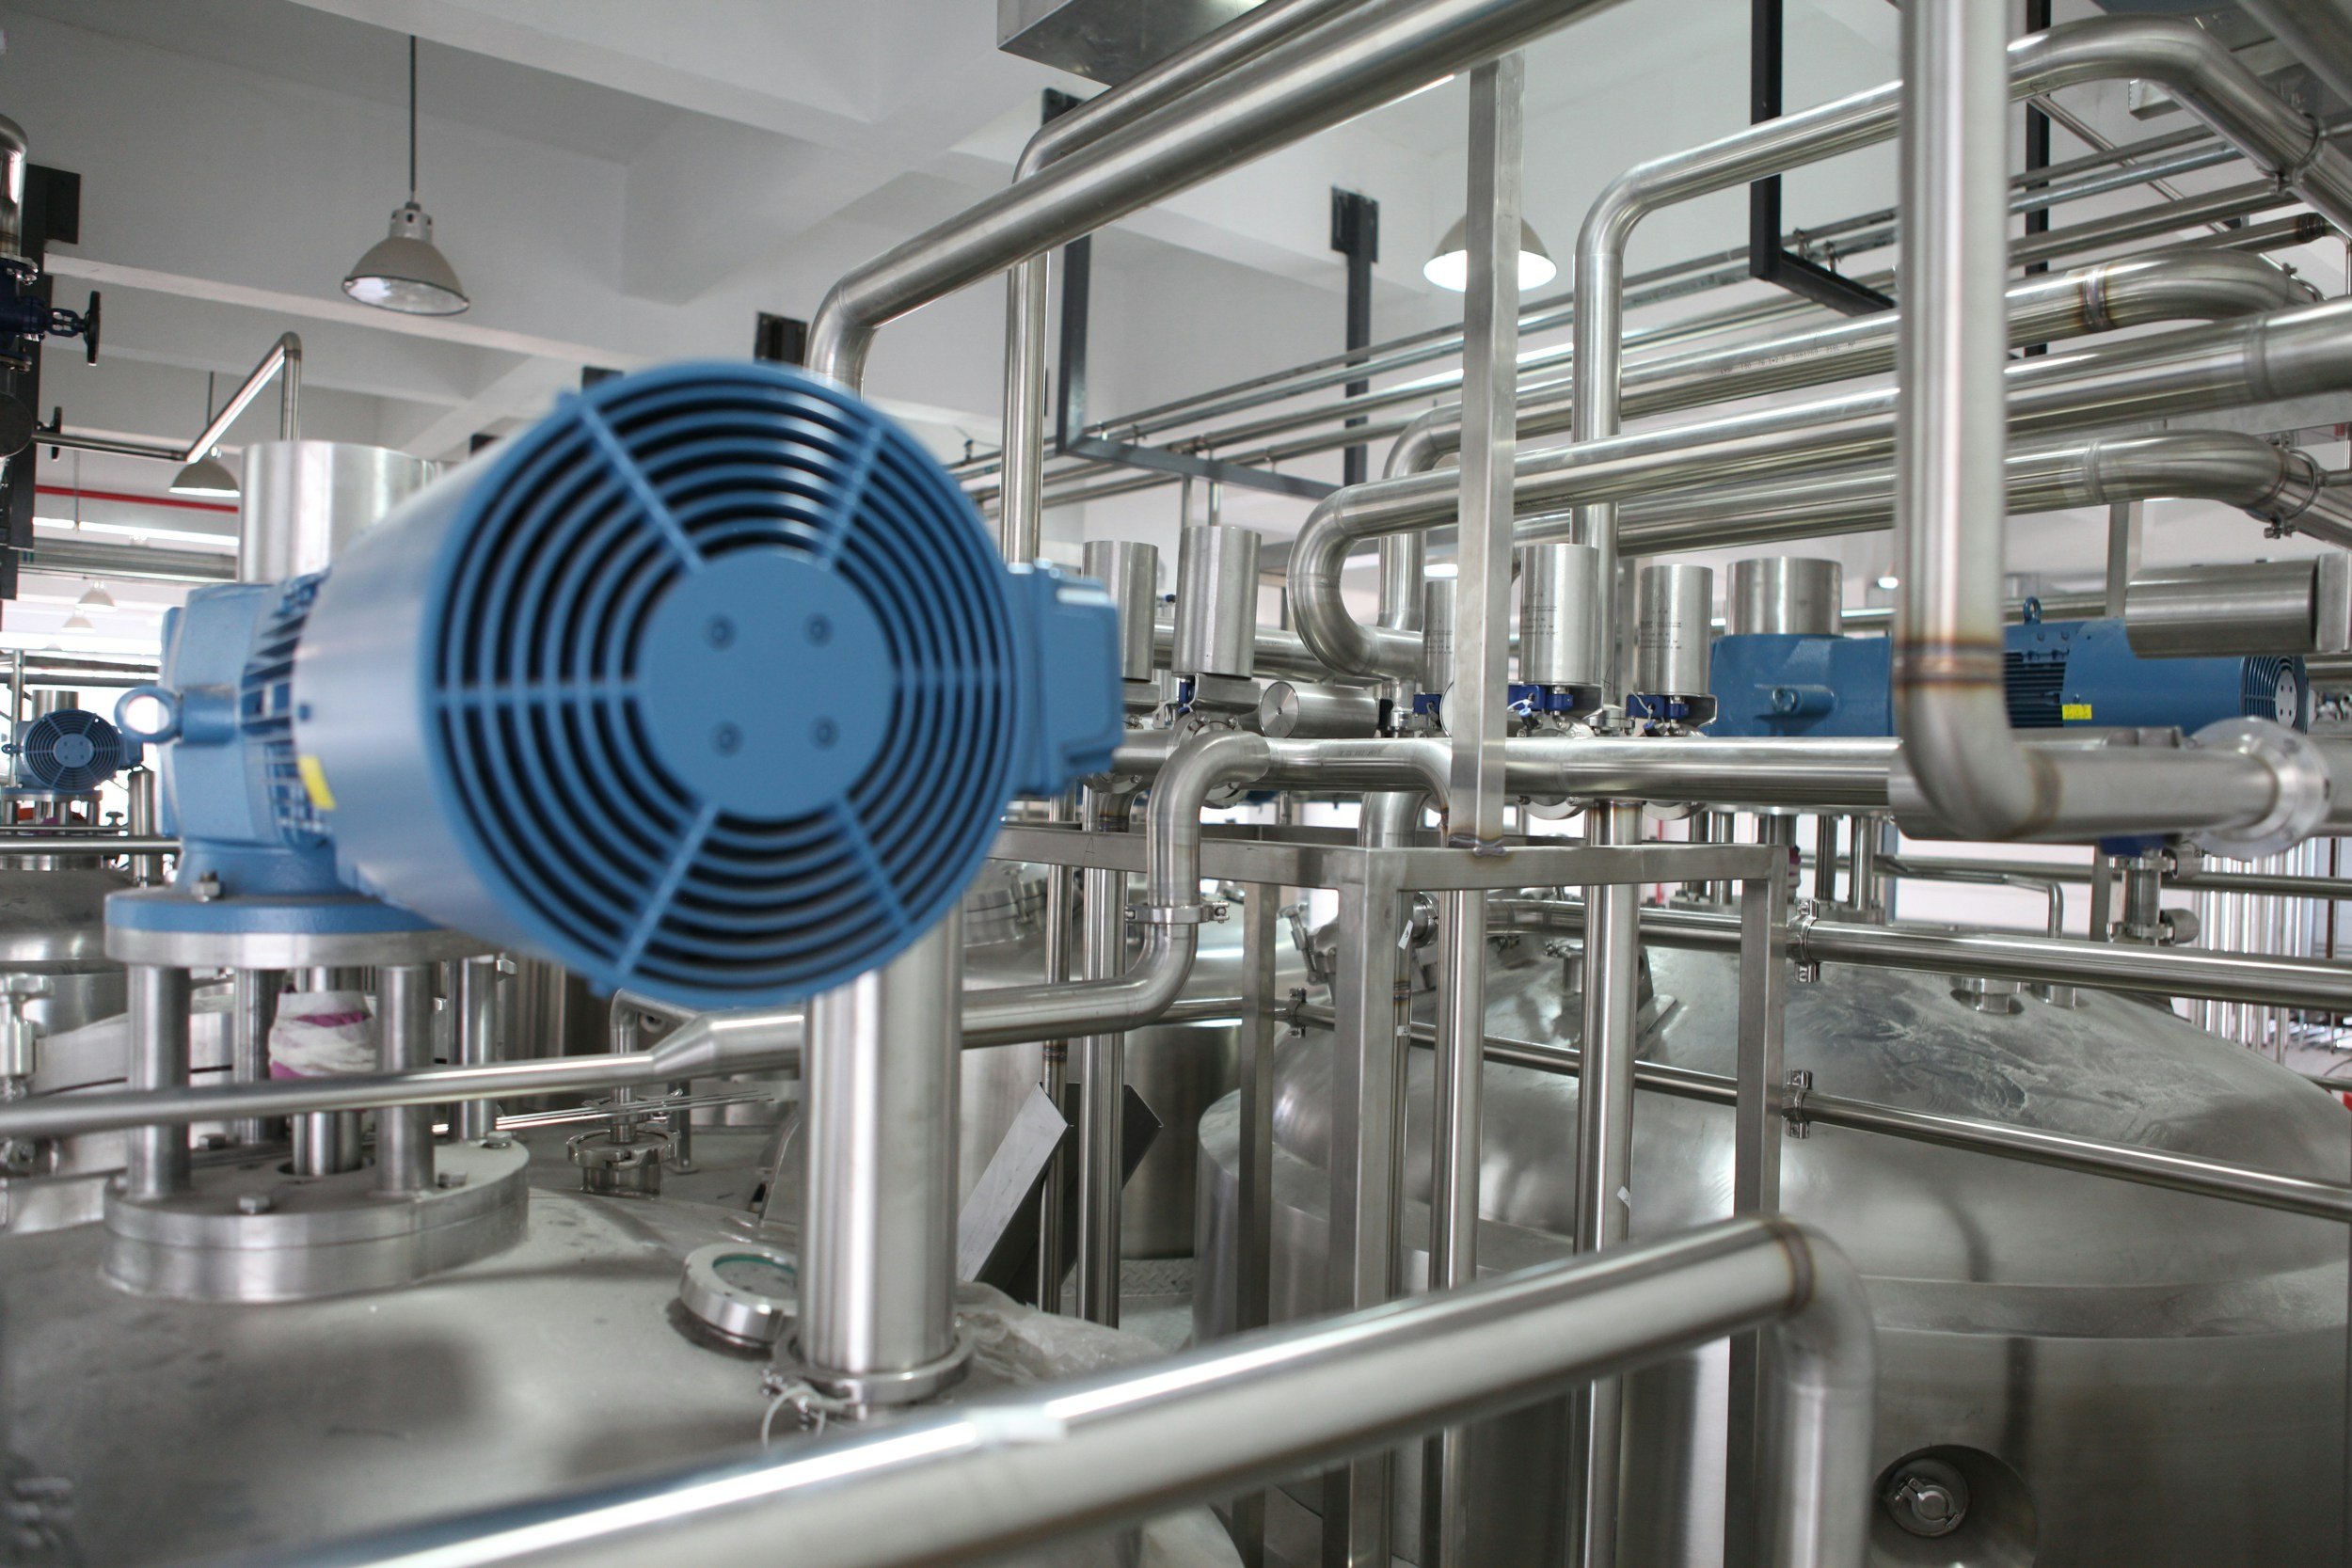
Industrial manufacturing facility
Indoor Air Quality

Monitor CO₂, temperature, noise, fumes and humidity in real time with no disruption to occupants. Receive instant alerts when parameters exceed limits, helping you respond quickly and keep spaces comfortable and safe.

  • Less guesswork around ventilation and heating
  • Clear evidence for stakeholders and building management